Interpreting Line Graphs and Analyzing Trends
Interactive Video
•
Mathematics
•
6th - 10th Grade
•
Practice Problem
•
Hard
+1
Standards-aligned

Sophia Harris
Used 3+ times
FREE Resource
Standards-aligned
Read more
10 questions
Show all answers
1.
MULTIPLE CHOICE QUESTION
30 sec • 1 pt
What is the essential question you should be able to answer by the end of the lesson?
How can you use a line graph to interpret data?
How can you use a bar graph to interpret data?
How can you use a scatter plot to interpret data?
How can you use a pie chart to interpret data?
Tags
CCSS.2.MD.D.10
2.
MULTIPLE CHOICE QUESTION
30 sec • 1 pt
What do line graphs typically show?
Data that remains constant
Data that changes over time
Data that is qualitative
Data that is categorical
3.
MULTIPLE CHOICE QUESTION
30 sec • 1 pt
What is the first step in constructing a line graph?
Analyzing the data
Choosing a number scale
Drawing the axes
Plotting the points
4.
MULTIPLE CHOICE QUESTION
30 sec • 1 pt
In the push-ups graph, between which days is the greatest change observed?
Monday and Tuesday
Tuesday and Wednesday
Wednesday and Thursday
Friday and Saturday
Tags
CCSS.6.NS.C.7C
5.
MULTIPLE CHOICE QUESTION
30 sec • 1 pt
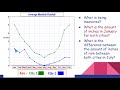
What is being measured in the temperature graph of New York City?
Mobile phone sales
Temperatures in degrees Fahrenheit
Number of push-ups
Average monthly rainfall
6.
MULTIPLE CHOICE QUESTION
30 sec • 1 pt
In the rainfall graph, what is the difference in inches of rain between the two cities in July?
3 inches
2 inches
1 inch
0 inches
Tags
CCSS.2.MD.B.5
7.
MULTIPLE CHOICE QUESTION
30 sec • 1 pt
What year had the least amount of mobile phone sales?
2013
2014
2011
2010
Tags
CCSS.HSN.VM.C.6
Access all questions and much more by creating a free account
Create resources
Host any resource
Get auto-graded reports
Continue with Google

Continue with Email
Continue with Classlink
Continue with Clever
or continue with
Microsoft
%20(1).png)
Apple
Others
Already have an account?
Popular Resources on Wayground

15 questions
Fractions on a Number Line
Quiz
•
3rd Grade
10 questions
Probability Practice
Quiz
•
4th Grade
15 questions
Probability on Number LIne
Quiz
•
4th Grade
20 questions
Equivalent Fractions
Quiz
•
3rd Grade
25 questions
Multiplication Facts
Quiz
•
5th Grade
22 questions
fractions
Quiz
•
3rd Grade
6 questions
Appropriate Chromebook Usage
Lesson
•
7th Grade
10 questions
Greek Bases tele and phon
Quiz
•
6th - 8th Grade
Discover more resources for Mathematics
20 questions
Writing Algebraic Expressions
Quiz
•
6th Grade
20 questions
Ratios/Rates and Unit Rates
Quiz
•
6th Grade
14 questions
Volume of rectangular prisms
Quiz
•
7th Grade
23 questions
TSI Math Vocabulary
Quiz
•
10th - 12th Grade
15 questions
Graphing Inequalities
Quiz
•
7th - 9th Grade
20 questions
Graphing Inequalities on a Number Line
Quiz
•
6th - 9th Grade
20 questions
One Step Equations
Quiz
•
6th Grade
12 questions
One-Step Equations
Quiz
•
6th Grade