Exploring Scatterplot Associations
Interactive Video
•
Mathematics
•
8th - 12th Grade
•
Practice Problem
•
Easy
Standards-aligned

Mia Campbell
Used 1+ times
FREE Resource
Standards-aligned
Read more
10 questions
Show all answers
1.
MULTIPLE CHOICE QUESTION
30 sec • 1 pt
What is a scatter plot?
A graph with a line connecting all points
A graph with random dots representing data points
A pie chart with different sections
A bar chart with multiple bars
Tags
CCSS.8.SP.A.1
2.
MULTIPLE CHOICE QUESTION
30 sec • 1 pt
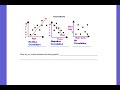
What type of correlation is shown when the data points trend upwards?
Inverse correlation
Positive correlation
No correlation
Negative correlation
Tags
CCSS.HSS.ID.B.5
3.
MULTIPLE CHOICE QUESTION
30 sec • 1 pt
Which of the following is an example of a positive correlation?
As price increases, demand increases
As age increases, weight increases
As age increases, weight decreases
As price increases, demand decreases
Tags
CCSS.HSS.ID.B.5
4.
MULTIPLE CHOICE QUESTION
30 sec • 1 pt
What type of correlation is shown when the data points trend downwards?
Positive correlation
No correlation
Negative correlation
Direct correlation
Tags
CCSS.HSS.ID.B.5
5.
MULTIPLE CHOICE QUESTION
30 sec • 1 pt
Which of the following pairs is an example of no correlation?
Height and weight
Income and education level
Hair color and shoe size
Age and shoe size
Tags
CCSS.HSS.ID.B.5
6.
MULTIPLE CHOICE QUESTION
30 sec • 1 pt
In a scatter plot, what does it mean if there is no discernible pattern?
Positive correlation
No correlation
Inverse correlation
Negative correlation
Tags
CCSS.HSS.ID.B.5
7.
MULTIPLE CHOICE QUESTION
30 sec • 1 pt
Which keyword is associated with a positive correlation?
Downward
Decrease
Increase
No relationship
Tags
CCSS.HSS.ID.B.5
Access all questions and much more by creating a free account
Create resources
Host any resource
Get auto-graded reports
Continue with Google

Continue with Email
Continue with Classlink
Continue with Clever
or continue with
Microsoft
%20(1).png)
Apple
Others
Already have an account?
Popular Resources on Wayground

15 questions
Fractions on a Number Line
Quiz
•
3rd Grade
20 questions
Equivalent Fractions
Quiz
•
3rd Grade
25 questions
Multiplication Facts
Quiz
•
5th Grade
22 questions
fractions
Quiz
•
3rd Grade
20 questions
Main Idea and Details
Quiz
•
5th Grade
20 questions
Context Clues
Quiz
•
6th Grade
15 questions
Equivalent Fractions
Quiz
•
4th Grade
20 questions
Figurative Language Review
Quiz
•
6th Grade
Discover more resources for Mathematics
15 questions
Product of Powers Property A1 U7
Quiz
•
8th Grade
20 questions
Laws of Exponents
Quiz
•
8th Grade
16 questions
8th U5L5 Graphs of Functions
Quiz
•
8th Grade
20 questions
Graphing Inequalities on a Number Line
Quiz
•
6th - 9th Grade
12 questions
Exponential Growth and Decay
Quiz
•
9th Grade
20 questions
Exponent Rules Review
Quiz
•
8th - 9th Grade
20 questions
One Step equations addition and subtraction
Quiz
•
5th - 8th Grade
20 questions
Translations
Quiz
•
8th Grade