
Rithwik
5th Grade
•96 Qs

Similar activities
OSN IPA SD
1st - 5th Grade
•100 Qs
Benchmark 2/STAAR Review
5th Grade
•93 Qs
5th Grade Science Milestones Practice
5th Grade
•100 Qs
Utah SEEd
5th Grade
•96 Qs
UH ipa tema 6 kelas 5
5th Grade
•100 Qs
CFE: Common Final Exam 6th Grade 1st and 2nd Quarter
5th - 7th Grade
•93 Qs
PBMS THN 6 2020_1
3rd - 8th Grade
•94 Qs
Year in Review
5th Grade
•94 Qs

Rithwik
Quiz
•
Science
•
5th Grade
•
Practice Problem
•
Easy

ammu swaroopa
Used 2+ times
FREE Resource
Enhance your content in a minute
96 questions
Show all answers
1.
MULTIPLE CHOICE QUESTION
30 sec • 1 pt

A PIE Chart is created using
Cherries
Apples
Data
Cars
Answer explanation
A PIE Chart is created using data, as it represents different categories or values visually through proportional slices of a circle.
2.
MULTIPLE CHOICE QUESTION
30 sec • 1 pt

32 people went to a ice hockey match. The pie chart shows the colours of their shirts. How many people wore black?
45
1
4
Answer explanation
The correct choice is 4 because the pie chart shows that 1/8 of the people wore black, which corresponds to 4 people out of 32.
3.
MULTIPLE CHOICE QUESTION
30 sec • 1 pt
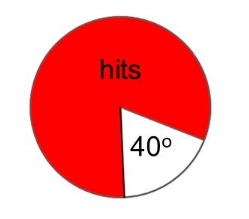
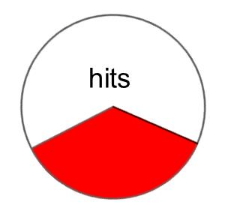
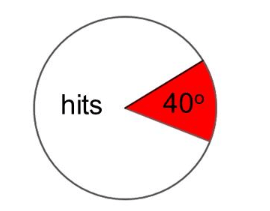
A darts player hits his target 40% of the time. Which pie chart represents his hits and misses?

4.
MULTIPLE CHOICE QUESTION
30 sec • 1 pt

This pie chart shows the colour of hats that Tom owns. Which colour hat does he own the second most of?
red
blue
green
yellow
Answer explanation
The second most owned hat color is blue according to the pie chart.
5.
MULTIPLE CHOICE QUESTION
30 sec • 1 pt

This pie chart shows the colour of hats that Tim owns. What fraction of Tim's hats are blue?
impossible to say
Answer explanation
The fraction of Tim's hats that are blue is 1/4 based on the pie chart provided.
6.
MULTIPLE CHOICE QUESTION
30 sec • 1 pt

These pie charts show how people travel to work in 2 towns. In which town do more people travel to work by bike?
town A
town B
both the same
impossible to say
Answer explanation
In town B, more people travel to work by bike as the pie chart segment for biking is larger compared to town A. Therefore, the correct choice is town B.
7.
MULTIPLE CHOICE QUESTION
30 sec • 1 pt

Which Continent is home to 36% of the wild cats?
Asia
Africa
North America
South America
Answer explanation
Asia is home to 36% of the wild cats, making it the correct choice for this question.


Access all questions and much more by creating a free account
Create resources
Host any resource
Get auto-graded reports
Continue with Google

Continue with Email
Continue with Classlink
Continue with Clever
or continue with
Microsoft
%20(1).png)
Apple
Others
Already have an account?
Similar Resources on Wayground
92 questions
Unit 1 Grade 5 Matter and properties
Quiz
•
5th Grade
100 questions
Cambridge Science 1-2
Quiz
•
1st Grade - University
94 questions
Ultimate 5th Grade Science Vocabulary
Quiz
•
5th Grade
93 questions
Science SOL Review
Quiz
•
5th Grade
100 questions
latihan soal lctp
Quiz
•
5th Grade
91 questions
Question Bank for Grade 5 Science
Quiz
•
5th Grade
92 questions
Rica practice 1
Quiz
•
5th Grade
96 questions
y3 final revision
Quiz
•
3rd Grade - University
Popular Resources on Wayground
15 questions
Fractions on a Number Line
Quiz
•
3rd Grade
20 questions
Equivalent Fractions
Quiz
•
3rd Grade
25 questions
Multiplication Facts
Quiz
•
5th Grade
54 questions
Analyzing Line Graphs & Tables
Quiz
•
4th Grade
22 questions
fractions
Quiz
•
3rd Grade
20 questions
Main Idea and Details
Quiz
•
5th Grade
20 questions
Context Clues
Quiz
•
6th Grade
15 questions
Equivalent Fractions
Quiz
•
4th Grade
Discover more resources for Science
20 questions
The Water Cycle
Quiz
•
5th Grade
20 questions
Weathering, Erosion, Deposition
Quiz
•
5th Grade
28 questions
4th Grade The Need for Speed
Quiz
•
3rd - 5th Grade
20 questions
Food Chains and Food Webs Review
Quiz
•
5th Grade
20 questions
The Water Cycle
Quiz
•
4th - 5th Grade
21 questions
Solar System Review
Quiz
•
5th Grade
20 questions
Food Webs
Quiz
•
5th Grade
20 questions
Earth Processes and Landforms
Quiz
•
5th Grade