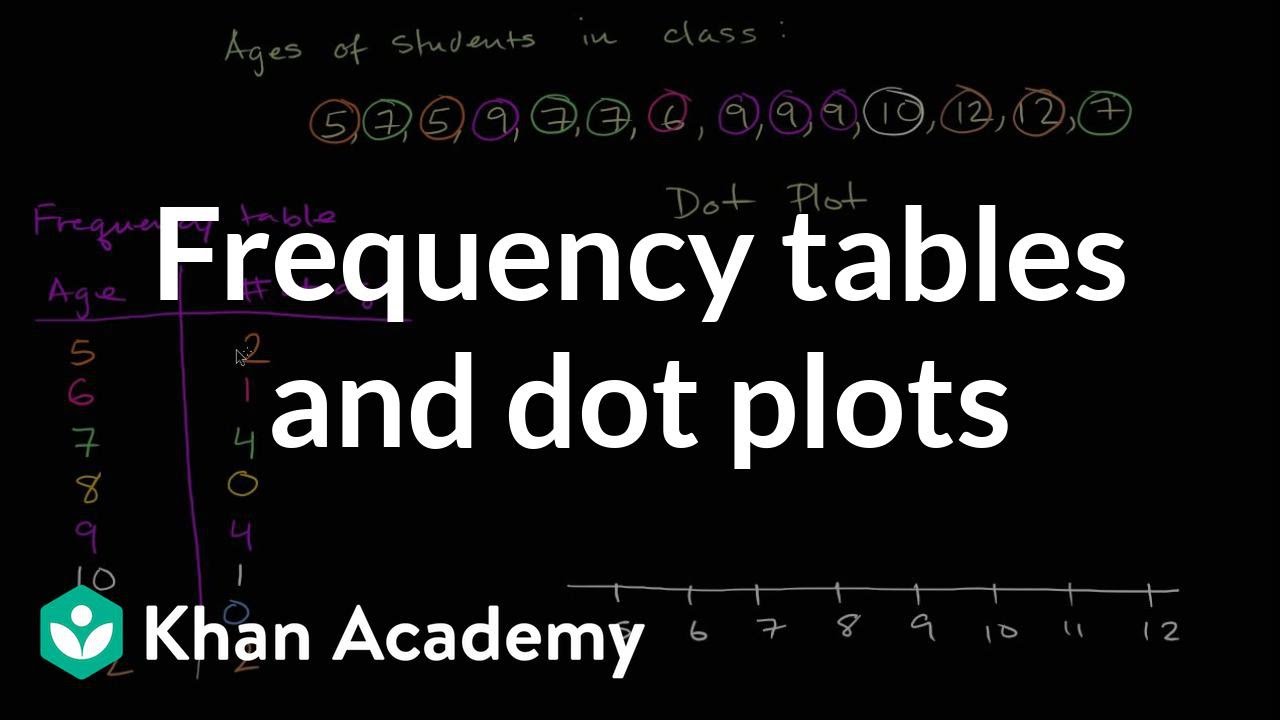
Understanding Data Representation
Interactive Video
•
Mathematics
•
6th - 10th Grade
•
Hard
+2
Standards-aligned

Wayground Content
FREE Resource
10 questions
Show all answers
1.
MULTIPLE CHOICE QUESTION
30 sec • 1 pt
What is the purpose of a frequency table?
To display the grades of students
To list the students' names alphabetically
To calculate the average age of students
To show how many students are of each age
2.
MULTIPLE CHOICE QUESTION
30 sec • 1 pt
How many students are 7 years old according to the frequency table?
Six
Four
None
Two
Tags
CCSS.3.MD.B.3
3.
MULTIPLE SELECT QUESTION
30 sec • 1 pt
Which age group had no students?
Eight
Eleven
Five
Ten
Tags
CCSS.6.SP.B.4
CCSS.HSS.ID.A.1
4.
MULTIPLE CHOICE QUESTION
30 sec • 1 pt
What is the minimum age represented in the data?
Six
Five
Seven
Four
Tags
CCSS.2.MD.D.9
5.
MULTIPLE CHOICE QUESTION
30 sec • 1 pt
How is frequency defined in the context of this data?
The average number of students
The total number of students
The number of students of each age
The difference between the highest and lowest ages
Tags
CCSS.6.SP.B.5A
6.
MULTIPLE CHOICE QUESTION
30 sec • 1 pt
What does a dot plot visually represent?
The average age of students
The total number of students in the class
The highest and lowest ages only
The number of students at each age using dots
Tags
CCSS.6.SP.B.4
CCSS.HSS.ID.A.1
7.
MULTIPLE CHOICE QUESTION
30 sec • 1 pt
What advantage does a dot plot have over a frequency table?
It shows the exact number of students in the class
It calculates the average age more accurately
It visually represents data for easier comparison
It lists students' names and ages
Create a free account and access millions of resources
Similar Resources on Wayground

11 questions
Analyze Two Way Tables
Quiz
•
8th - 9th Grade

15 questions
STATISTIC Data Analysis
Quiz
•
6th Grade

10 questions
Calculating and Comparing Means in Everyday Life
Quiz
•
5th Grade - University

10 questions
Histogram Quiz
Quiz
•
6th Grade

15 questions
7th 6-2 Draw Inferences from Data
Quiz
•
7th Grade

12 questions
Random Sampling
Quiz
•
7th - 8th Grade

10 questions
Word problems of linear equations 💜
Quiz
•
7th Grade

10 questions
Writing Inequalities
Quiz
•
6th Grade
Popular Resources on Wayground

10 questions
Video Games
Quiz
•
6th - 12th Grade

20 questions
Brand Labels
Quiz
•
5th - 12th Grade

15 questions
Core 4 of Customer Service - Student Edition
Quiz
•
6th - 8th Grade

15 questions
What is Bullying?- Bullying Lesson Series 6-12
Lesson
•
11th Grade

25 questions
Multiplication Facts
Quiz
•
5th Grade

15 questions
Subtracting Integers
Quiz
•
7th Grade

22 questions
Adding Integers
Quiz
•
6th Grade

10 questions
Exploring Digital Citizenship Essentials
Interactive video
•
6th - 10th Grade
Discover more resources for Mathematics

15 questions
Subtracting Integers
Quiz
•
7th Grade

22 questions
Adding Integers
Quiz
•
6th Grade

20 questions
Multiplying and Dividing Integers
Quiz
•
7th Grade

10 questions
Parallel Lines Cut by a Transversal
Quiz
•
8th Grade

20 questions
Perfect Squares and Square Roots
Quiz
•
7th Grade

20 questions
Adding and Subtracting integers
Quiz
•
7th Grade

20 questions
Adding and Subtracting Integers
Quiz
•
6th Grade

20 questions
Adding and Subtracting Integers
Quiz
•
6th Grade
