Association, Causation, & Correlation Coefficient
Quiz
•
Mathematics
•
8th - 9th Grade
•
Medium
Standards-aligned
Kenzie Bramblett
Used 72+ times
FREE Resource
10 questions
Show all answers
1.
MULTIPLE CHOICE QUESTION
1 min • 5 pts

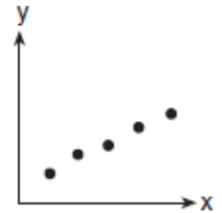
What type of association does this graph have?
Strong Positive
Weak Negative
Weak Positive
Strong Negative
Answer explanation

HINT:
Positive Correlation: Line goes up
Negative Correlation: Line goes down
No Correlation: Can't see a line
Tags
CCSS.HSS.ID.B.5
2.
MULTIPLE CHOICE QUESTION
1 min • 5 pts

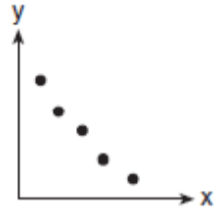
What type of association does this scatter plot represent?
Positive Linear Association
Negative Linear Association
No Association
Answer explanation

HINT:
Positive Correlation: Line goes up
Negative Correlation: Line goes down
No Correlation: Can't see a line
Tags
CCSS.HSS.ID.B.5
3.
MULTIPLE CHOICE QUESTION
1 min • 5 pts

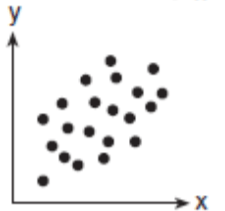
Estimate the correlation coefficient
r = 1
r = -1
r ≈ -0.8
r ≈ 0.8
r ≈ -0.5
Answer explanation
HINT:
Positive Correlation: Line goes up
Negative Correlation: Line goes down
The closer to zero you are, the weaker your line is.
Tags
CCSS.HSS.ID.C.8
4.
MULTIPLE CHOICE QUESTION
1 min • 5 pts
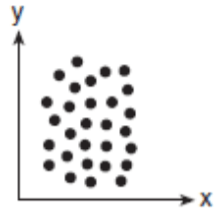
Which scatter plot diagram shows the strongest positive correlation?


Answer explanation
HINT:
Positive Correlation: Line goes up
Negative Correlation: Line goes down
The closer to zero you are, the weaker your line is.
Tags
CCSS.HSS.ID.B.5
5.
MULTIPLE CHOICE QUESTION
1 min • 5 pts
Billy is in the store comparing bags of candy.
A bag that contains only 1 candy is $3. A bag that contains 2 candies is $5. A bag that contains 3 candies is $8. Lastly, a bag that contains 5 candies is $17.
Decide what the correlation coefficient of the following situation is.
r = 0.99
Strong Negative
r = -0.98
Strong Negative
r = 0.99
Strong Positive
r = -0.98
Strong Positive
Answer explanation

HINT: The amount of candy is your X. The cost in dollars is your Y.
Create a table to use stat edit (4:LinReg). Make sure your diagnostics is on!
Tags
CCSS.HSS.ID.C.8
6.
FILL IN THE BLANK QUESTION
1 min • 5 pts

Determine the Correlation Coefficient (r) of the situation.
Round to the hundredths place (two decimal places)
Answer explanation
HINT: Use stat edit (4:LinReg). Make sure your diagnostics are on!
Tags
CCSS.HSS.ID.C.8
7.
MULTIPLE CHOICE QUESTION
1 min • 5 pts
Causation or Association:
The hotter the temperature of the oven, the less time needed to cook a turkey.
Causation
Association
Answer explanation
HINT: Causation is where one event is the result of the occurrence of the other event.
Tags
CCSS.HSS.ID.C.9
Create a free account and access millions of resources
Create resources
Host any resource
Get auto-graded reports

Continue with Google

Continue with Email

Continue with Classlink

Continue with Clever
or continue with

Microsoft
%20(1).png)
Apple
Others
By signing up, you agree to our Terms of Service & Privacy Policy
Already have an account?
Similar Resources on Wayground

10 questions
mathematician
Quiz
•
8th Grade

15 questions
Estatística e Probabilidade para 9º Ano
Quiz
•
9th Grade

10 questions
9º Ano - Matemática 2
Quiz
•
9th Grade

15 questions
Probabilités - sec 3
Quiz
•
9th Grade

15 questions
Quiz Materi Transformasi Geometri
Quiz
•
9th Grade

10 questions
Perpangkatan Positif
Quiz
•
9th Grade

10 questions
Nombres relatifs (niveau 1)
Quiz
•
8th - 9th Grade

14 questions
Fractions Percentages Decimal of Number
Quiz
•
8th Grade
Popular Resources on Wayground

10 questions
Honoring the Significance of Veterans Day
Interactive video
•
6th - 10th Grade

10 questions
Exploring Veterans Day: Facts and Celebrations for Kids
Interactive video
•
6th - 10th Grade

19 questions
Veterans Day
Quiz
•
5th Grade

25 questions
Multiplication Facts
Quiz
•
5th Grade

15 questions
Circuits, Light Energy, and Forces
Quiz
•
5th Grade

6 questions
FOREST Self-Discipline
Lesson
•
1st - 5th Grade

7 questions
Veteran's Day
Interactive video
•
3rd Grade

20 questions
Weekly Prefix check #2
Quiz
•
4th - 7th Grade
Discover more resources for Mathematics

13 questions
Finding slope from graph
Quiz
•
8th Grade

20 questions
Slope from a Graph
Quiz
•
8th Grade

14 questions
finding slope from a graph
Quiz
•
8th Grade

15 questions
Two Step Equations
Quiz
•
9th Grade

9 questions
3.2.5 8th U3T2 Quiz Review IM
Quiz
•
8th Grade

19 questions
Explore Triangle Congruence and Proofs
Quiz
•
9th - 12th Grade

20 questions
Distance time graphs
Quiz
•
8th Grade

10 questions
Exploring DNA Structure and Function
Interactive video
•
6th - 8th Grade
