
Bar and Picture Graphs
Quiz
•
Mathematics
•
2nd - 4th Grade
•
Hard
+7
Standards-aligned
Rachel Benge
Used 126+ times
FREE Resource
22 questions
Show all answers
1.
MULTIPLE CHOICE QUESTION
1 min • 1 pt

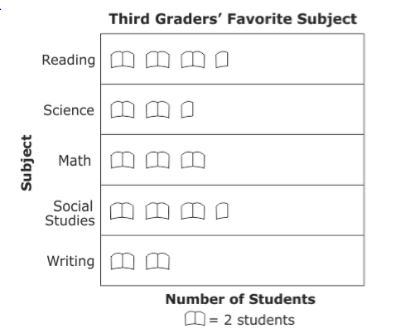
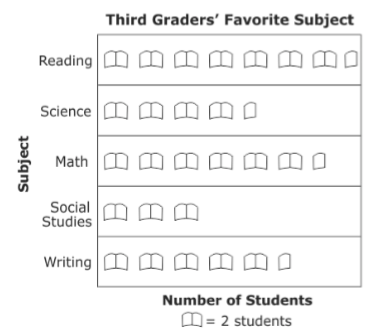
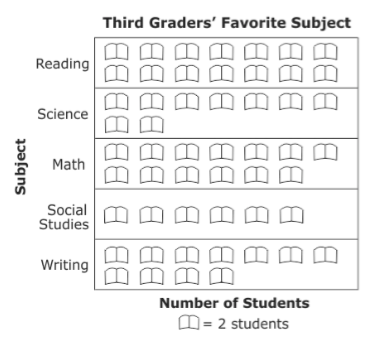
Students in 3rd grade collected data on their favorite subject and recorded it on the table shown. Which graph shows this information?
Tags
CCSS.3.MD.B.3
2.
MULTIPLE CHOICE QUESTION
1 min • 1 pt

Students voted for their favorite ice cream topping. How many more students chose marshmallows than chose nuts?
4
6
10
Tags
CCSS.3.OA.D.8
3.
MULTIPLE CHOICE QUESTION
1 min • 1 pt

The bar graph shows the number of hamburgers sold at Bob’s Burger Shack. On which days were more than 80 hamburgers sold?
Wednesday and Friday
Tuesday and Thursday
Monday, Tuesday, and Thursday
Tuesday, Wednesday, Thursday, and Friday
Tags
CCSS.3.MD.B.3
4.
MULTIPLE CHOICE QUESTION
1 min • 1 pt

The graph shows the number of colored beads used to make a necklace. How many purple and green beads were used in all?
23
20
18
15
Tags
CCSS.3.OA.D.8
5.
MULTIPLE CHOICE QUESTION
1 min • 1 pt

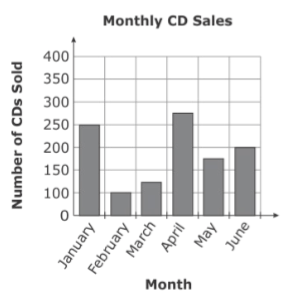
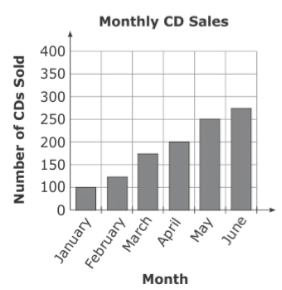
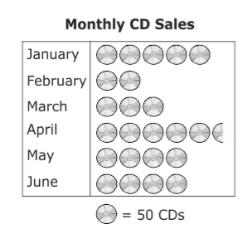
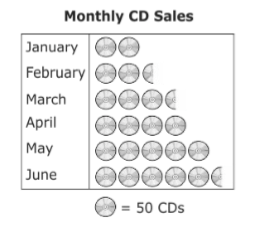
In the chart , a music store listed the number of CDs sold each month for 6 months. Which graph correctly represents the information in the chart?
Tags
CCSS.HSN.VM.C.6
6.
MULTIPLE CHOICE QUESTION
30 sec • 1 pt

Tags
CCSS.3.OA.D.8
7.
MULTIPLE CHOICE QUESTION
3 mins • 1 pt

Tags
CCSS.4.NBT.B.5
Create a free account and access millions of resources
Similar Resources on Wayground

21 questions
Yr.3 Statistics and Data Review
Quiz
•
3rd Grade

20 questions
Bar Graphs
Quiz
•
3rd - 4th Grade

22 questions
Data Analysis
Quiz
•
2nd Grade

20 questions
data handling
Quiz
•
3rd Grade

20 questions
3rd MATH Vocabulary
Quiz
•
2nd - 3rd Grade

21 questions
Bar and Picto graphs
Quiz
•
3rd Grade

20 questions
Line Graph Practice
Quiz
•
4th - 6th Grade

18 questions
Unit 4 Data Analysis Review
Quiz
•
3rd - 5th Grade
Popular Resources on Wayground

10 questions
Video Games
Quiz
•
6th - 12th Grade

20 questions
Brand Labels
Quiz
•
5th - 12th Grade

15 questions
Core 4 of Customer Service - Student Edition
Quiz
•
6th - 8th Grade

15 questions
What is Bullying?- Bullying Lesson Series 6-12
Lesson
•
11th Grade

25 questions
Multiplication Facts
Quiz
•
5th Grade

15 questions
Subtracting Integers
Quiz
•
7th Grade

22 questions
Adding Integers
Quiz
•
6th Grade

10 questions
Exploring Digital Citizenship Essentials
Interactive video
•
6th - 10th Grade
Discover more resources for Mathematics

10 questions
Place Value
Quiz
•
3rd Grade

20 questions
place value
Quiz
•
4th Grade

10 questions
Order of Operations No Exponents
Quiz
•
4th - 5th Grade

20 questions
Place Value and Rounding
Quiz
•
4th Grade

15 questions
Place Value
Quiz
•
4th Grade

20 questions
Division Facts
Quiz
•
3rd Grade

10 questions
Input Output Tables
Quiz
•
4th Grade

20 questions
Equal Groups
Quiz
•
3rd Grade


