Distance Time Graphs Quiz
Authored by Sarah Bhanji
Science
6th Grade
CCSS covered
Used 65+ times

AI Actions
Add similar questions
Adjust reading levels
Convert to real-world scenario
Translate activity
More...
Content View
Student View
10 questions
Show all answers
1.
MULTIPLE CHOICE QUESTION
2 mins • 1 pt

What does this graph represent?
Tags
CCSS.8.EE.B.5
2.
MULTIPLE CHOICE QUESTION
2 mins • 1 pt

How long did it take this object to travel 10 m?
Tags
CCSS.8.EE.B.5
3.
MULTIPLE CHOICE QUESTION
2 mins • 1 pt

What does this graph represent?
Tags
CCSS.8.EE.B.5
4.
MULTIPLE CHOICE QUESTION
30 sec • 1 pt
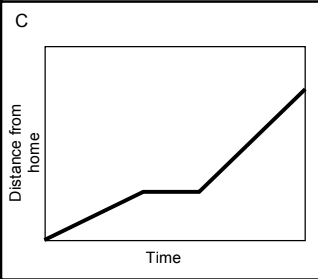
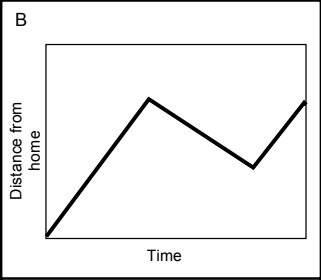
Match the description to the graph:
"The car is coming back."


Tags
CCSS.8.EE.B.5
5.
MULTIPLE CHOICE QUESTION
30 sec • 1 pt
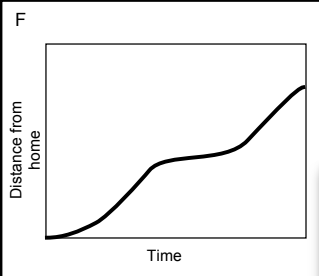
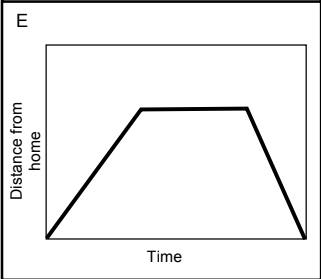
Match the description to the graph:
"The speed of the car is decreasing."
Tags
CCSS.8.EE.B.5
6.
MULTIPLE CHOICE QUESTION
2 mins • 1 pt

At 60 seconds, how far had this object traveled?
Tags
CCSS.8.EE.B.5
7.
MULTIPLE CHOICE QUESTION
45 sec • 1 pt

At what rate did the rain fall?
Tags
CCSS.HSF-LE.A.1B


Access all questions and much more by creating a free account
Create resources
Host any resource
Get auto-graded reports
Continue with Google

Continue with Email
Continue with Classlink
Continue with Clever
or continue with
Microsoft
%20(1).png)
Apple
Others
Already have an account?
