
Analyzing Graphs
Quiz
•
Mathematics
•
2nd - 3rd Grade
•
Practice Problem
•
Medium
Standards-aligned
Mari Galindo-Sanchez
Used 147+ times
FREE Resource
Enhance your content in a minute
10 questions
Show all answers
1.
MULTIPLE CHOICE QUESTION
30 sec • 1 pt

The bar graph shows the number of tokens earned by each house in Mrs. Martin's class.
Based on the data which statement is true?
The blue house earned more tokens than the red and yellow houses combined.
The red house earned more tokens than the yellow house.
The orange house earned the most tokens.
The yellow house earned the least tokens.
Tags
CCSS.3.MD.B.3
2.
MULTIPLE CHOICE QUESTION
30 sec • 1 pt

The graph shows the number of farm animals on Nate's farm.
How many more sheep are there than horses and pig combined?
4
1
2
6
Tags
CCSS.3.OA.D.8
3.
MULTIPLE CHOICE QUESTION
3 mins • 1 pt

How many students like vanilla and chocolate?
8
32
30
28
Tags
CCSS.3.MD.B.3
4.
MULTIPLE CHOICE QUESTION
1 min • 1 pt

Jack made this graph to show the number of movies that were rented from his store during four months.
How many more movies were rented in December than in September?
20
35
45
80
Tags
CCSS.3.OA.D.8
5.
MULTIPLE CHOICE QUESTION
1 min • 1 pt

What is the difference between the amount of 3rd graders who own a dog than a snake or hamster combined?
8
2
6
4
Tags
CCSS.2.MD.D.9
6.
MULTIPLE CHOICE QUESTION
1 min • 1 pt

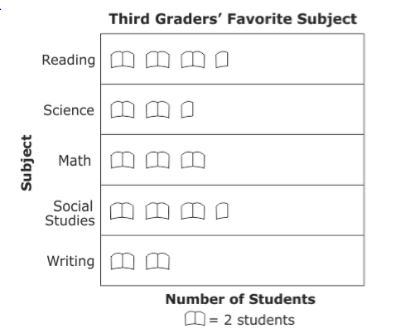
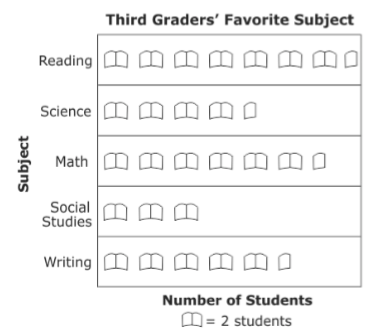
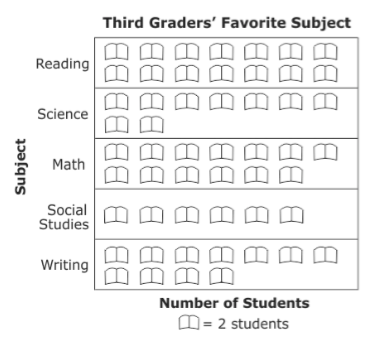
Students in 3rd grade collected data on their favorite subject and recorded it on the table shown. Which graph shows this information?
Tags
CCSS.3.MD.B.3
7.
MULTIPLE CHOICE QUESTION
1 min • 1 pt

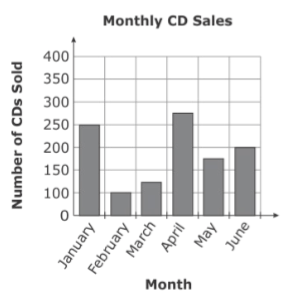
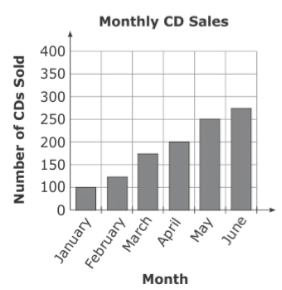
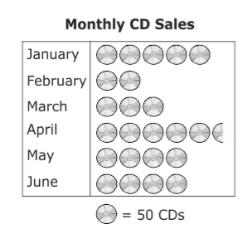
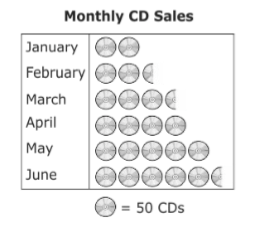
In the chart, a music store listed the number of CDs sold each month for 6 months. Which graph correctly represents the information in the chart?
Tags
CCSS.3.MD.B.3
Access all questions and much more by creating a free account
Create resources
Host any resource
Get auto-graded reports

Continue with Google

Continue with Email

Continue with Classlink

Continue with Clever
or continue with

Microsoft
%20(1).png)
Apple
Others
Already have an account?
Similar Resources on Wayground

10 questions
MUSIC MATHS
Quiz
•
KG - 5th Grade

10 questions
Multiplication arrays
Quiz
•
2nd - 3rd Grade

10 questions
3- digit addition
Quiz
•
2nd - 3rd Grade

10 questions
MENTAL ARITHMETIC
Quiz
•
3rd Grade

13 questions
fractions multipication
Quiz
•
2nd - 3rd Grade

10 questions
Wk 7 Lesson 1, Word Problems
Quiz
•
3rd Grade

12 questions
Mathematics
Quiz
•
3rd Grade

10 questions
The Great Quizmas Battle
Quiz
•
1st - 3rd Grade
Popular Resources on Wayground

15 questions
Fractions on a Number Line
Quiz
•
3rd Grade

20 questions
Equivalent Fractions
Quiz
•
3rd Grade

25 questions
Multiplication Facts
Quiz
•
5th Grade

54 questions
Analyzing Line Graphs & Tables
Quiz
•
4th Grade

22 questions
fractions
Quiz
•
3rd Grade

20 questions
Main Idea and Details
Quiz
•
5th Grade

20 questions
Context Clues
Quiz
•
6th Grade

15 questions
Equivalent Fractions
Quiz
•
4th Grade
Discover more resources for Mathematics

15 questions
Fractions on a Number Line
Quiz
•
3rd Grade

20 questions
Equivalent Fractions
Quiz
•
3rd Grade

22 questions
fractions
Quiz
•
3rd Grade

18 questions
Comparing Fractions with same numerator or denominator
Quiz
•
3rd Grade

12 questions
Fractions on a numberline review
Quiz
•
3rd Grade

10 questions
Area
Quiz
•
3rd Grade

20 questions
Fractions
Quiz
•
3rd Grade

100 questions
100 multiplication facts
Quiz
•
3rd Grade


