11/19 - Correlation Coefficient & Linear Regression
Authored by Erin Berg
Mathematics
8th - 10th Grade
CCSS covered
Used 343+ times

AI Actions
Add similar questions
Adjust reading levels
Convert to real-world scenario
Translate activity
More...
Content View
Student View
20 questions
Show all answers
1.
MULTIPLE CHOICE QUESTION
15 mins • 1 pt
If x is temperature and y is coffee sales, use the following formula to determine the coffee sales on a 34° day.
y = -60x+6443
$4584
$4673
$8303
Tags
CCSS.HSF.LE.B.5
2.
MULTIPLE CHOICE QUESTION
5 mins • 1 pt

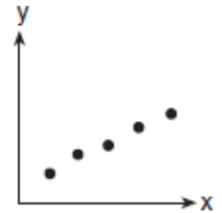
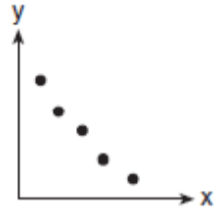
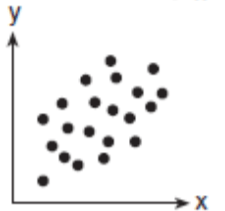
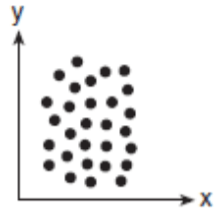
Describe the correlation in the graph shown.
Tags
CCSS.HSF-LE.A.1B
3.
MULTIPLE CHOICE QUESTION
15 mins • 1 pt

A restaurant sells pizza for the prices in the data table. Calculate the linear regression equation of the data.
y = 1.5x + 12
y = 12x + 1.5
y = 0.67x - 8
y = -8x + 0.67
Tags
CCSS.8.EE.C.8C
4.
MULTIPLE CHOICE QUESTION
15 mins • 1 pt

The chart below tracts starting salaries for health care workers since the year 2000. Using linear regression, find the equation of best fit. Round decimals to 3 places.
Tags
CCSS.HSF-LE.A.1B
5.
MULTIPLE CHOICE QUESTION
5 mins • 1 pt
What is a best-fit line used for?
Tags
CCSS.8.EE.B.5
6.
MULTIPLE CHOICE QUESTION
15 mins • 1 pt

Find the equation of the line of best fit for the given data
y = 163.41x+1.49
y =- 163.41x+ 4.19
y =- 4.19x+163.41
y = 4.19x -163.41
Tags
CCSS.HSS.ID.B.6
CCSS.HSS.ID.C.7
CCSS.HSA.CED.A.2
7.
MULTIPLE CHOICE QUESTION
5 mins • 1 pt

Write the equation for the linear regression shown.
Tags
CCSS.HSS.ID.C.7
Access all questions and much more by creating a free account
Create resources
Host any resource
Get auto-graded reports

Continue with Google

Continue with Email

Continue with Classlink

Continue with Clever
or continue with

Microsoft
%20(1).png)
Apple
Others
Already have an account?
Similar Resources on Wayground

20 questions
LATIHAN SOAL 1
Quiz
•
9th Grade

20 questions
1.0 INDEKS Tingkatan 3
Quiz
•
KG - Professional Dev...

16 questions
Actividad 11: Multiplicación de signos
Quiz
•
9th Grade

15 questions
REVISÃO A1
Quiz
•
8th Grade

18 questions
Teza clasa a VII-a sem.II
Quiz
•
7th - 8th Grade

17 questions
Применение производной
Quiz
•
1st - 10th Grade

20 questions
Penilaian Harian Ke- 1 Materi Bilangan Berpangkat dan Bentuk Akar
Quiz
•
9th Grade

15 questions
Grade 8 - Geometry Terms
Quiz
•
7th - 8th Grade
Popular Resources on Wayground

15 questions
Fractions on a Number Line
Quiz
•
3rd Grade

20 questions
Equivalent Fractions
Quiz
•
3rd Grade

25 questions
Multiplication Facts
Quiz
•
5th Grade

54 questions
Analyzing Line Graphs & Tables
Quiz
•
4th Grade

22 questions
fractions
Quiz
•
3rd Grade

20 questions
Main Idea and Details
Quiz
•
5th Grade

20 questions
Context Clues
Quiz
•
6th Grade

15 questions
Equivalent Fractions
Quiz
•
4th Grade
Discover more resources for Mathematics

14 questions
finding slope from a graph
Quiz
•
8th Grade

20 questions
Laws of Exponents
Quiz
•
8th Grade

12 questions
8th U5L9 Linear Models
Quiz
•
8th Grade

20 questions
Graphing Inequalities on a Number Line
Quiz
•
6th - 9th Grade

18 questions
SAT Prep: Ratios, Proportions, & Percents
Quiz
•
9th - 10th Grade

20 questions
Volume of cylinders, Cones and Spheres
Quiz
•
8th Grade

12 questions
Exponential Growth and Decay
Quiz
•
9th Grade

20 questions
One Step equations addition and subtraction
Quiz
•
5th - 8th Grade


