Distance Time Graph reading
Authored by Aaron Anderson
Science
6th Grade
CCSS covered
Used 23+ times

AI Actions
Add similar questions
Adjust reading levels
Convert to real-world scenario
Translate activity
More...
Content View
Student View
15 questions
Show all answers
1.
MULTIPLE CHOICE QUESTION
2 mins • 1 pt

How long did it take this object to travel 10 m?
Tags
CCSS.8.EE.B.5
2.
MULTIPLE CHOICE QUESTION
30 sec • 1 pt

Which runner had a head start?
Tags
CCSS.8.EE.B.5
3.
MULTIPLE CHOICE QUESTION
30 sec • 1 pt

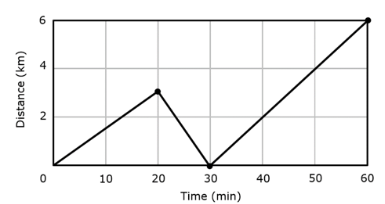
A student runs two times around a running path at a local park. Each lap is 3 km. The student completes the first lap in 20 minutes. The student then sits on a bench and rest for 5 minutes before completing the second lap in 25 minutes. Which graph bests represents the student's motion?
Tags
CCSS.8.EE.B.5
4.
MULTIPLE CHOICE QUESTION
2 mins • 1 pt

Which graph shows a person returning to the start line?
A
B
C
D
Tags
CCSS.8.EE.B.5
5.
MULTIPLE CHOICE QUESTION
1 min • 1 pt

Molly is watching a wind-up toy walking across a table. She observes that the toy covers 1 cm every second for 10 seconds. Which graph do you think most closely represents the toy's journey across the table?
Tags
CCSS.8.EE.B.5
6.
MULTIPLE CHOICE QUESTION
30 sec • 1 pt
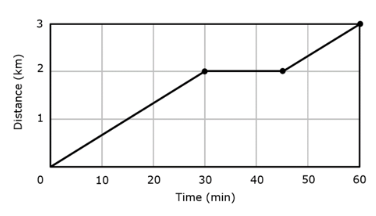
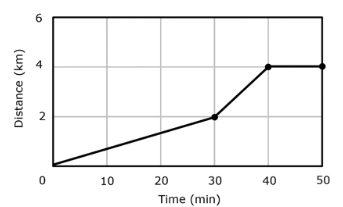
A student walks 2.0 km in a time of 30 minutes. The student then stop for 15 minutes to eat a snack then travels 1.0 km in 15 minutes.
Which graph shows the journey described?
Tags
CCSS.8.EE.B.5
7.
MULTIPLE CHOICE QUESTION
30 sec • 1 pt

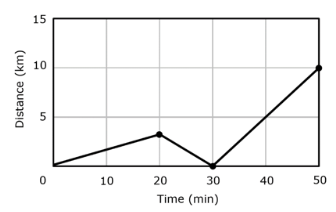
Edward drove 80 miles from his home to London.
He stopped and visited his friend Nicola on the way. Here is the distance-time graph for the journey.
How far was Edward from home when he visited Nicola?
30 miles
40 miles
10 miles
45 miles
Tags
CCSS.HSF.IF.B.4


Access all questions and much more by creating a free account
Create resources
Host any resource
Get auto-graded reports
Continue with Google

Continue with Email
Continue with Classlink
Continue with Clever
or continue with
Microsoft
%20(1).png)
Apple
Others
Already have an account?
Similar Resources on Wayground

17 questions
PROPERTIES OF MATERIALS
Quiz
•
5th - 6th Grade
11 questions
Unit 9: Taxonomic Groups
Quiz
•
6th Grade
10 questions
Animals Everywhere
Quiz
•
3rd - 7th Grade
13 questions
Graphing Vocabulary
Quiz
•
6th Grade
20 questions
6. Sınıf Sistemler Karışık
Quiz
•
6th Grade
14 questions
Lesson 7,8,9 Weather By: Nolansville including Alex, Nolan, Bo
Quiz
•
5th - 6th Grade
20 questions
6° Science Review
Quiz
•
6th Grade
16 questions
Stores of energy: review
Quiz
•
6th Grade
Popular Resources on Wayground
15 questions
Fractions on a Number Line
Quiz
•
3rd Grade
20 questions
Equivalent Fractions
Quiz
•
3rd Grade
25 questions
Multiplication Facts
Quiz
•
5th Grade
29 questions
Alg. 1 Section 5.1 Coordinate Plane
Quiz
•
9th Grade
22 questions
fractions
Quiz
•
3rd Grade
11 questions
FOREST Effective communication
Lesson
•
KG
20 questions
Main Idea and Details
Quiz
•
5th Grade
20 questions
Context Clues
Quiz
•
6th Grade
Discover more resources for Science
20 questions
Rocks and The Rock Cycle
Quiz
•
6th Grade
15 questions
Rock Cycle
Quiz
•
6th Grade
10 questions
Exploring the Rock Cycle
Interactive video
•
6th - 8th Grade
20 questions
Waves and Wave Properties
Quiz
•
6th - 8th Grade
10 questions
Understand Ecosystem Roles and Energy Flow
Interactive video
•
6th - 8th Grade
20 questions
Thermal Energy - Heat Transfer
Quiz
•
6th Grade
10 questions
Exploring the Rock Cycle: Types and Formation
Interactive video
•
6th - 8th Grade
22 questions
Layers of the Atmosphere
Quiz
•
6th Grade