Graphing ratios
Mathematics
6th Grade
TEKS covered
Used 423+ times

AI Actions
Add similar questions
Adjust reading levels
Convert to real-world scenario
Translate activity
More...
Content View
Student View
8 questions
Show all answers
1.
MULTIPLE CHOICE QUESTION
30 sec • 1 pt

Which point is at (6,0)
Point A
Point B
Point C
Point D
Tags
CCSS.5.G.A.2
2.
MULTIPLE CHOICE QUESTION
30 sec • 1 pt

What is the ordered pair of Point E?
(4,7)
(3,7)
(7,4)
(7,3)
Tags
CCSS.5.G.A.1
3.
MULTIPLE CHOICE QUESTION
5 mins • 1 pt

What is the missing number in the ratio table?
Tags
CCSS.6.RP.A.1
CCSS.6.RP.A.3
4.
MULTIPLE SELECT QUESTION
30 sec • 1 pt

What are the ordered pairs for number of cups to pounds of sugar?
(20,4)
(40,8)
(60,12)
(16,50)
Tags
TEKS.MATH.7.4A
5.
MULTIPLE CHOICE QUESTION
30 sec • 1 pt
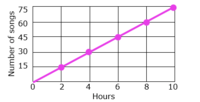
How many songs would there be in 12 hours?
80 songs
15 songs
90 songs
65 songs
Tags
TEKS.MATH.7.4A
6.
MULTIPLE CHOICE QUESTION
30 sec • 1 pt

How much does the number of hand bags sold increase by per day?
20
15
5
1
Tags
CCSS.7.RP.A.2D
7.
MULTIPLE CHOICE QUESTION
30 sec • 1 pt

Based on the graph, how many people would there be in 7 days?
30
36
42
48
Tags
TEKS.MATH.5.4C


Access all questions and much more by creating a free account
Create resources
Host any resource
Get auto-graded reports
Continue with Google

Continue with Email
Continue with Classlink
Continue with Clever
or continue with
Microsoft
%20(1).png)
Apple
Others
Already have an account?
Similar Resources on Wayground

10 questions
TOÁN UCMAS KG4
Quiz
•
2nd - 11th Grade
10 questions
15.HAFTA
Quiz
•
6th Grade
12 questions
ทบทวน เรื่อง เศษส่วน ม.1
Quiz
•
6th - 8th Grade
10 questions
Geometry: Reflections & Translations
Quiz
•
5th - 6th Grade
10 questions
Perkalian 4 full
Quiz
•
1st - 10th Grade
10 questions
คณิตศาสตร์ ป.6
Quiz
•
1st Grade - University
10 questions
Math Grade 6
Quiz
•
6th Grade
10 questions
Quadratics: Difference of squares
Quiz
•
5th - 7th Grade
Popular Resources on Wayground
7 questions
History of Valentine's Day
Interactive video
•
4th Grade
15 questions
Fractions on a Number Line
Quiz
•
3rd Grade
20 questions
Equivalent Fractions
Quiz
•
3rd Grade
25 questions
Multiplication Facts
Quiz
•
5th Grade
22 questions
fractions
Quiz
•
3rd Grade
15 questions
Valentine's Day Trivia
Quiz
•
3rd Grade
20 questions
Main Idea and Details
Quiz
•
5th Grade
20 questions
Context Clues
Quiz
•
6th Grade
Discover more resources for Mathematics
20 questions
Writing Algebraic Expressions
Quiz
•
6th Grade
20 questions
Ratios/Rates and Unit Rates
Quiz
•
6th Grade
20 questions
Graphing Inequalities on a Number Line
Quiz
•
6th - 9th Grade
20 questions
One Step Equations
Quiz
•
6th Grade
10 questions
Solving One Step Inequalities
Quiz
•
6th Grade
15 questions
Equivalent Ratios
Quiz
•
6th Grade
16 questions
2022 Winter Olympics Medal Table
Passage
•
6th - 8th Grade
20 questions
Writing Ratios & Identifying Equivalent Ratios
Quiz
•
6th Grade