
Graphing Linear Equations
7th - 8th Grade
•40 Qs

Similar activities
STATISTIKA
8th Grade
•35 Qs
Lluosi a Rhannu Lluosrifau 10, 100, 1000
7th - 8th Grade
•35 Qs
Système solaire
8th Grade
•36 Qs
SUMATIF AKHIR SEMESTER (SAS) SMP PGRI 2 CISOLOK 2023/2024
8th Grade
•40 Qs
اختبار من (120 - 140) نموذج (85) ا/وليد الجنزوري0508249931
1st - 12th Grade
•45 Qs
Module 2: Statistics Pre-test
8th - 9th Grade
•36 Qs
Congruence
8th Grade
•35 Qs
Review Review Review - BOY->ANGLES
7th Grade
•40 Qs

Graphing Linear Equations
Quiz
•
Mathematics
•
7th - 8th Grade
•
Practice Problem
•
Medium
+10
Standards-aligned

Kelsey Tomes
Used 21+ times
FREE Resource
Enhance your content in a minute
40 questions
Show all answers
1.
MULTIPLE CHOICE QUESTION
5 mins • 1 pt
The point where the line crosses the y-axis is called the:
Tags
CCSS.8.F.A.3
CCSS.8.F.B.4
2.
MULTIPLE CHOICE QUESTION
5 mins • 1 pt

What is the y-intercept of the line?
Tags
CCSS.HSA.CED.A.2
CCSS.HSA.REI.D.10
CCSS.HSS.ID.C.7
3.
MULTIPLE CHOICE QUESTION
5 mins • 1 pt

What is the x- intercept of the line?
Tags
CCSS.HSA.CED.A.2
CCSS.HSA.REI.D.10
CCSS.HSA.REI.D.11
4.
MULTIPLE CHOICE QUESTION
5 mins • 1 pt
In the following equation, what is the y-intercept?
y = -3x + 7
Tags
CCSS.8.EE.B.6
CCSS.8.F.A.3
5.
MULTIPLE CHOICE QUESTION
5 mins • 1 pt

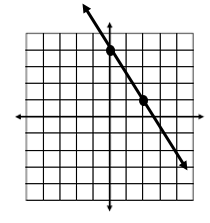
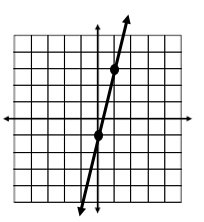
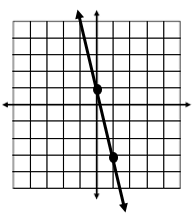
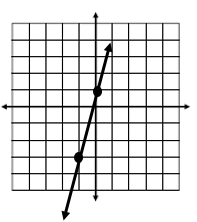
Which graph represents the table?


Tags
CCSS.8.EE.B.5
6.
MULTIPLE CHOICE QUESTION
5 mins • 1 pt
Which graph represents the equation
Tags
CCSS.HSA.CED.A.2
CCSS.HSA.REI.D.10
CCSS.HSF.IF.B.4
CCSS.HSF.IF.C.7
7.
MULTIPLE CHOICE QUESTION
5 mins • 1 pt

Which graph represents the table?


Tags
CCSS.8.EE.B.5


Access all questions and much more by creating a free account
Create resources
Host any resource
Get auto-graded reports
Continue with Google

Continue with Email
Continue with Classlink
Continue with Clever
or continue with
Microsoft
%20(1).png)
Apple
Others
Already have an account?
Similar Resources on Wayground
43 questions
Proving Triangles Congruent - Quiz Review
Quiz
•
8th - 11th Grade
40 questions
Fraction me This!
Quiz
•
6th - 8th Grade
45 questions
Mathematics 7 QUARTER 2
Quiz
•
7th Grade
35 questions
Rekenen automatiseren groep 6/7/8
Quiz
•
6th - 9th Grade
35 questions
Factoring Trinomials
Quiz
•
8th - 9th Grade
35 questions
PAT Matematika Kelas 7
Quiz
•
7th Grade
40 questions
Matematika Kelas VIII Semester Ganjil
Quiz
•
8th Grade
35 questions
Statistika Kelas 7 Kurikulum Merdeka
Quiz
•
7th Grade
Popular Resources on Wayground
15 questions
Fractions on a Number Line
Quiz
•
3rd Grade
20 questions
Equivalent Fractions
Quiz
•
3rd Grade
25 questions
Multiplication Facts
Quiz
•
5th Grade
54 questions
Analyzing Line Graphs & Tables
Quiz
•
4th Grade
22 questions
fractions
Quiz
•
3rd Grade
20 questions
Main Idea and Details
Quiz
•
5th Grade
20 questions
Context Clues
Quiz
•
6th Grade
15 questions
Equivalent Fractions
Quiz
•
4th Grade
Discover more resources for Mathematics
22 questions
distributive property
Quiz
•
7th Grade
18 questions
Angle Relationships
Quiz
•
7th Grade
20 questions
How Some Friendships Last — and Others Don’t Video Questions
Quiz
•
7th Grade
14 questions
finding slope from a graph
Quiz
•
8th Grade
18 questions
Handbook Refresher Quiz
Quiz
•
7th Grade
20 questions
Laws of Exponents
Quiz
•
8th Grade
12 questions
8th U5L9 Linear Models
Quiz
•
8th Grade
20 questions
Graphing Inequalities on a Number Line
Quiz
•
6th - 9th Grade