Interpreting Graphs/Increasing & Decreasing Intervals
Authored by Katie Myers
Mathematics
8th - 10th Grade
CCSS covered
Used 234+ times

AI Actions
Add similar questions
Adjust reading levels
Convert to real-world scenario
Translate activity
More...
Content View
Student View
30 questions
Show all answers
1.
MULTIPLE CHOICE QUESTION
30 sec • 1 pt
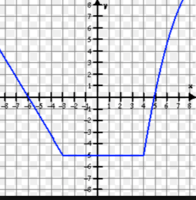
Over what interval is this function constant?
-5 < x < -2
-3 < x < 4
4 < x < 8
-5
Tags
CCSS.HSF.IF.B.4
2.
MULTIPLE CHOICE QUESTION
30 sec • 1 pt

When is the velocity decreasing?
Tags
CCSS.HSF.IF.B.4
CCSS.HSF.IF.C.7
3.
MULTIPLE CHOICE QUESTION
30 sec • 1 pt

When is this function increasing?
Tags
CCSS.HSF.IF.B.4
CCSS.HSF.IF.C.7
CCSS.HSF.IF.B.5
4.
MULTIPLE CHOICE QUESTION
30 sec • 1 pt

How long did it take Sam to get to school?
Tags
CCSS.8.EE.B.5
5.
MULTIPLE CHOICE QUESTION
30 sec • 1 pt

How long did Sam sit on the bench and wait for the bus?
Tags
CCSS.8.EE.B.5
6.
MULTIPLE CHOICE QUESTION
30 sec • 1 pt

Over which interval of time is this person returning home?
Tags
CCSS.HSF.IF.B.4
7.
MULTIPLE SELECT QUESTION
5 mins • 1 pt

This graph shows the amount of gas, in ounces, in a lawn mower gas tank, modeled as a function of time.
The maximum amount of gas in the gas tank was 60 ounces.
The amount of gas in the gas tank is at a maximum at 0 minutes.
The gas tank will be empty after 60 minutes.
Tags
CCSS.HSF.IF.B.4


Access all questions and much more by creating a free account
Create resources
Host any resource
Get auto-graded reports
Continue with Google

Continue with Email
Continue with Classlink
Continue with Clever
or continue with
Microsoft
%20(1).png)
Apple
Others
Already have an account?
Similar Resources on Wayground

25 questions
Ras MTK 8 genap1
Quiz
•
8th Grade
25 questions
Math Pre-test
Quiz
•
8th - 12th Grade
25 questions
Latihan UAS Ganjil MTK 8 2024/2025
Quiz
•
8th Grade
25 questions
REFLEKSI, TRANSFORMASI, ROTASI DAN DILATASI
Quiz
•
9th Grade
25 questions
kuis cerdas cermat
Quiz
•
10th Grade
25 questions
algebra
Quiz
•
10th Grade
26 questions
Palong Quiz 3rd 10
Quiz
•
10th Grade
25 questions
Test matematike
Quiz
•
8th Grade
Popular Resources on Wayground
15 questions
Fractions on a Number Line
Quiz
•
3rd Grade
20 questions
Equivalent Fractions
Quiz
•
3rd Grade
25 questions
Multiplication Facts
Quiz
•
5th Grade
54 questions
Analyzing Line Graphs & Tables
Quiz
•
4th Grade
22 questions
fractions
Quiz
•
3rd Grade
20 questions
Main Idea and Details
Quiz
•
5th Grade
20 questions
Context Clues
Quiz
•
6th Grade
15 questions
Equivalent Fractions
Quiz
•
4th Grade
Discover more resources for Mathematics
14 questions
finding slope from a graph
Quiz
•
8th Grade
20 questions
Laws of Exponents
Quiz
•
8th Grade
12 questions
8th U5L9 Linear Models
Quiz
•
8th Grade
20 questions
Graphing Inequalities on a Number Line
Quiz
•
6th - 9th Grade
18 questions
SAT Prep: Ratios, Proportions, & Percents
Quiz
•
9th - 10th Grade
20 questions
Volume of cylinders, Cones and Spheres
Quiz
•
8th Grade
12 questions
Exponential Growth and Decay
Quiz
•
9th Grade
20 questions
One Step equations addition and subtraction
Quiz
•
5th - 8th Grade