Graphing Linear Equations
Authored by Matthew McLendon
Mathematics
8th Grade
CCSS covered
Used 211+ times

AI Actions
Add similar questions
Adjust reading levels
Convert to real-world scenario
Translate activity
More...
Content View
Student View
8 questions
Show all answers
1.
MULTIPLE CHOICE QUESTION
5 mins • 1 pt
Which graph represents


Tags
CCSS.8.F.A.3
CCSS.8.F.B.4
CCSS.8.F.B.5
CCSS.8.F.A.1
CCSS.8.SP.A.3
CCSS.8.F.A.2
2.
MULTIPLE CHOICE QUESTION
5 mins • 1 pt

Which graph represents the table?


Tags
CCSS.8.EE.B.5
3.
MULTIPLE CHOICE QUESTION
5 mins • 1 pt
Which graph represents the equation
Tags
CCSS.8.F.A.3
CCSS.8.F.B.4
CCSS.8.F.B.5
CCSS.8.SP.A.3
4.
MULTIPLE CHOICE QUESTION
5 mins • 1 pt

Which graph represents the table?


Tags
CCSS.8.EE.B.5
5.
MULTIPLE CHOICE QUESTION
5 mins • 1 pt
Which graph represents


Tags
CCSS.8.EE.B.5
CCSS.8.F.A.3
CCSS.8.F.B.4
CCSS.8.F.B.5
CCSS.8.F.A.1
CCSS.8.EE.B.6
6.
MULTIPLE CHOICE QUESTION
5 mins • 1 pt

Which graph represents the table?


Tags
TEKS.MATH.8.4B
7.
MULTIPLE CHOICE QUESTION
5 mins • 1 pt

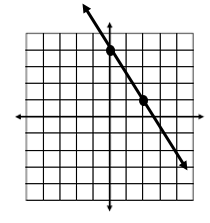
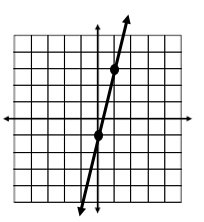
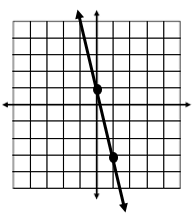
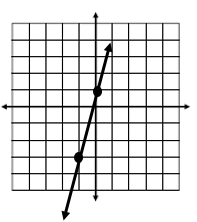
Graph. y = 2/3x - 3
Tags
CCSS.8.EE.B.5
CCSS.8.F.A.3
CCSS.8.F.B.4
CCSS.8.F.B.5
CCSS.8.F.A.1
CCSS.8.EE.B.6
CCSS.8.SP.A.2

Access all questions and much more by creating a free account
Create resources
Host any resource
Get auto-graded reports
Continue with Google

Continue with Email
Continue with Classlink
Continue with Clever
or continue with
Microsoft
%20(1).png)
Apple
Others
Already have an account?
Similar Resources on Wayground

11 questions
เลขยกกำลัง ม.1 by ครูยุ้ย
Quiz
•
6th - 8th Grade
10 questions
Proportionality
Quiz
•
7th - 8th Grade
10 questions
Kruse's Pythagorean and Its Converse
Quiz
•
8th Grade
13 questions
Evaluación #1 de matemáticas
Quiz
•
8th - 10th Grade
11 questions
Planteo de Ecuaciones
Quiz
•
1st - 10th Grade
10 questions
Skaidome dauginamaisiais
Quiz
•
8th Grade
10 questions
2nd Form Consumer Arithmetic
Quiz
•
8th Grade
10 questions
pemfaktoran dan pecahan algebra
Quiz
•
7th - 8th Grade
Popular Resources on Wayground
7 questions
History of Valentine's Day
Interactive video
•
4th Grade
15 questions
Fractions on a Number Line
Quiz
•
3rd Grade
20 questions
Equivalent Fractions
Quiz
•
3rd Grade
25 questions
Multiplication Facts
Quiz
•
5th Grade
22 questions
fractions
Quiz
•
3rd Grade
15 questions
Valentine's Day Trivia
Quiz
•
3rd Grade
20 questions
Main Idea and Details
Quiz
•
5th Grade
20 questions
Context Clues
Quiz
•
6th Grade
Discover more resources for Mathematics
20 questions
Laws of Exponents
Quiz
•
8th Grade
20 questions
Graphing Inequalities on a Number Line
Quiz
•
6th - 9th Grade
16 questions
2022 Winter Olympics Medal Table
Passage
•
6th - 8th Grade
20 questions
Complementary Supplementary Vertical Adjacent Angles
Quiz
•
8th Grade
20 questions
One Step equations addition and subtraction
Quiz
•
5th - 8th Grade
12 questions
Volume of cones and cylinders
Quiz
•
8th Grade
20 questions
Slope from a Graph
Quiz
•
8th Grade
15 questions
Combine Like Terms and Distributive Property
Quiz
•
8th - 9th Grade