Statistika
Authored by Erlina Susanti
Mathematics
12th Grade
CCSS covered
Used 148+ times

AI Actions
Add similar questions
Adjust reading levels
Convert to real-world scenario
Translate activity
More...
Content View
Student View
10 questions
Show all answers
1.
MULTIPLE CHOICE QUESTION
3 mins • 1 pt

Cermati tabel data distribusi frekuensi berikut !
Modus dari data tersebut adalah .....
73,5 cm
74,0 cm
74,5 cm
75,0 cm
75,5 cm
2.
MULTIPLE CHOICE QUESTION
3 mins • 1 pt

Median dari data tersebut adalah ....
61,16
61,38
62,83
65,53
67,83
3.
MULTIPLE CHOICE QUESTION
5 mins • 1 pt

Rata - rata data tersebut adalah...
8,15
9,15
10,5
11,25
11,5
4.
MULTIPLE CHOICE QUESTION
5 mins • 1 pt

Median data tersebut adalah...
37,83
37,5
32,5
32,83
41,83
5.
MULTIPLE CHOICE QUESTION
30 sec • 1 pt
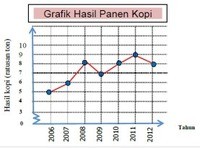
Grafik di atas menunjukkan hasil panen kopi. Kenaikan hasil panen sebesar 12,5% terjadi pada tahun ....
2008
2009
2010
2011
2012
6.
MULTIPLE CHOICE QUESTION
30 sec • 1 pt

Rata-rata dari diagram berikut yang disajikan pada gambar berikut 55,8. Maka nilai p adalah....
8
9
10
11
12
Tags
CCSS.6.SP.A.1
CCSS.6.SP.A.2
CCSS.6.SP.A.3
CCSS.6.SP.B.4
CCSS.6.SP.B.5
7.
MULTIPLE CHOICE QUESTION
30 sec • 1 pt

kelas modus berada pada interval
35,5 - 40,5
40,5 - 45,5
45,5 - 50,5
50,5 - 55,5


Access all questions and much more by creating a free account
Create resources
Host any resource
Get auto-graded reports
Continue with Google

Continue with Email
Continue with Classlink
Continue with Clever
or continue with
Microsoft
%20(1).png)
Apple
Others
Already have an account?
Similar Resources on Wayground

10 questions
Matemática Básica I
Quiz
•
12th Grade
10 questions
KHỐI ĐA DIỆN VÀ THỂ TÍCH KHỐI ĐA DIỆN
Quiz
•
12th Grade
10 questions
Múltiplos y divisores
Quiz
•
12th Grade
10 questions
Teoremas de ángulos y triángulos
Quiz
•
12th Grade
15 questions
ระบบจำนวนจริง
Quiz
•
12th Grade
15 questions
Luyện tập chung
Quiz
•
2nd Grade - University
10 questions
Bell Work 1/21
Quiz
•
7th Grade - University
15 questions
KUIS STATISTIKA AWAL BAG.2
Quiz
•
12th Grade
Popular Resources on Wayground
7 questions
History of Valentine's Day
Interactive video
•
4th Grade
15 questions
Fractions on a Number Line
Quiz
•
3rd Grade
20 questions
Equivalent Fractions
Quiz
•
3rd Grade
25 questions
Multiplication Facts
Quiz
•
5th Grade
22 questions
fractions
Quiz
•
3rd Grade
15 questions
Valentine's Day Trivia
Quiz
•
3rd Grade
20 questions
Main Idea and Details
Quiz
•
5th Grade
20 questions
Context Clues
Quiz
•
6th Grade
Discover more resources for Mathematics
10 questions
Factor Quadratic Expressions with Various Coefficients
Quiz
•
9th - 12th Grade
5 questions
Triangle Congruence Theorems
Interactive video
•
9th - 12th Grade
15 questions
Exponential Growth and Decay Word Problems Practice
Quiz
•
9th - 12th Grade
20 questions
special right triangles
Quiz
•
9th - 12th Grade
20 questions
Interpreting Scatter Plots
Quiz
•
8th - 12th Grade
15 questions
Writing Ratios
Quiz
•
6th - 12th Grade
21 questions
Apply Polynomial Multiplication Techniques
Quiz
•
9th - 12th Grade
30 questions
Quad Properties Identify Only
Quiz
•
9th - 12th Grade