
Features of Functions + Function Algebra
9th Grade
•15 Qs

Similar activities
แบบทดสอบปลายภาค 1 ม.3
9th Grade
•15 Qs
masa dan waktu tahun 5
4th - 12th Grade
•20 Qs
Math Quiz
7th - 9th Grade
•15 Qs
ATS MATHS Y9 M2
9th Grade
•12 Qs
Quiz # 13 Topic 10 and 11
9th Grade
•10 Qs
Enters (Easy)
7th - 12th Grade
•16 Qs
Paper 1 Mathematics PT3
8th - 10th Grade
•20 Qs
Quiz Day 4 Topic 3
9th Grade
•10 Qs

Features of Functions + Function Algebra
Quiz
•
Mathematics
•
9th Grade
•
Practice Problem
•
Medium
+10
Standards-aligned

Brandon Baldomero
Used 670+ times
FREE Resource
Enhance your content in a minute
15 questions
Show all answers
1.
MULTIPLE CHOICE QUESTION
15 mins • 1 pt

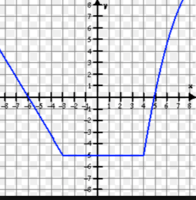
What is the y-intercept?
Tags
CCSS.HSA.CED.A.2
CCSS.HSA.REI.D.10
CCSS.HSF.IF.B.4
CCSS.HSF.IF.C.7
CCSS.HSS.ID.C.7
2.
MULTIPLE CHOICE QUESTION
15 mins • 1 pt

What is the minimum of this graph?
Tags
CCSS.HSF-IF.C.7A
3.
MULTIPLE CHOICE QUESTION
15 mins • 1 pt

What is the maximum height?
200
50
3
0
Tags
CCSS.HSA.CED.A.1
CCSS.HSA.CED.A.2
CCSS.HSA.REI.B.4
CCSS.HSA.REI.D.10
CCSS.HSA.SSE.A.1
4.
MULTIPLE CHOICE QUESTION
15 mins • 1 pt
When is the maximum height reached?
200
50
3
0
Tags
CCSS.HSA.REI.B.4
CCSS.HSA.SSE.A.1
5.
MULTIPLE CHOICE QUESTION
15 mins • 1 pt

What is the minimum?
Tags
CCSS.HSF-IF.C.7A
6.
MULTIPLE CHOICE QUESTION
15 mins • 1 pt

What is the domain of the graph?
from x = 1 to x = 4
from x = 2 to x = 6
from y = 1 to y = 4
from y = 2 to y = 6
Tags
CCSS.8.F.A.1
CCSS.HSF.IF.B.5
7.
MULTIPLE CHOICE QUESTION
15 mins • 1 pt
What is the range of the graph?
from x = 1 to x = 4
from x = 2 to x = 6
from y = 1 to y = 4
from y = 2 to y = 6
Tags
CCSS.8.F.A.1
CCSS.HSF.IF.B.5


Access all questions and much more by creating a free account
Create resources
Host any resource
Get auto-graded reports
Continue with Google

Continue with Email
Continue with Classlink
Continue with Clever
or continue with
Microsoft
%20(1).png)
Apple
Others
Already have an account?
Similar Resources on Wayground
11 questions
Operaciones con números enteros y racionales.
Quiz
•
1st - 10th Grade
10 questions
Perkalian 4 full
Quiz
•
1st - 10th Grade
10 questions
Remedial Ulangan Aplikasi Turunan kelas XII ACM 3
Quiz
•
9th - 12th Grade
10 questions
คณิตศาสตร์ ป.6
Quiz
•
1st Grade - University
20 questions
trigonometri
Quiz
•
9th - 12th Grade
19 questions
ميل المستقيمات المتعامدة والمتوازية
Quiz
•
8th - 10th Grade
10 questions
MATHS 10 REVISION 3
Quiz
•
9th - 10th Grade
10 questions
Tambah dan tolak perpuluhan
Quiz
•
1st - 9th Grade
Popular Resources on Wayground
7 questions
History of Valentine's Day
Interactive video
•
4th Grade
15 questions
Fractions on a Number Line
Quiz
•
3rd Grade
20 questions
Equivalent Fractions
Quiz
•
3rd Grade
25 questions
Multiplication Facts
Quiz
•
5th Grade
22 questions
fractions
Quiz
•
3rd Grade
15 questions
Valentine's Day Trivia
Quiz
•
3rd Grade
20 questions
Main Idea and Details
Quiz
•
5th Grade
20 questions
Context Clues
Quiz
•
6th Grade
Discover more resources for Mathematics
20 questions
Graphing Inequalities on a Number Line
Quiz
•
6th - 9th Grade
20 questions
Exponent Properties
Quiz
•
9th Grade
15 questions
Combine Like Terms and Distributive Property
Quiz
•
8th - 9th Grade
20 questions
Function or Not a Function
Quiz
•
8th - 9th Grade
10 questions
Factor Quadratic Expressions with Various Coefficients
Quiz
•
9th - 12th Grade
10 questions
Elijah McCoy: Innovations and Impact in Black History
Interactive video
•
6th - 10th Grade
21 questions
Factoring Trinomials (a=1)
Quiz
•
9th Grade
5 questions
Triangle Congruence Theorems
Interactive video
•
9th - 12th Grade