Writing Linear Equations Quiz Review
Authored by Michelle Pace
Mathematics
7th - 9th Grade
CCSS covered
Used 1K+ times

AI Actions
Add similar questions
Adjust reading levels
Convert to real-world scenario
Translate activity
More...
Content View
Student View
16 questions
Show all answers
1.
MULTIPLE CHOICE QUESTION
30 sec • 1 pt
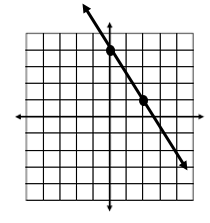
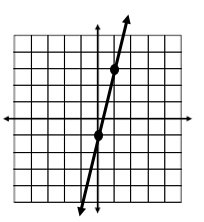
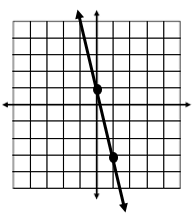
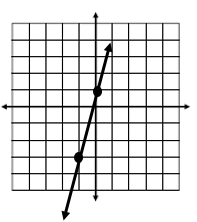
Which graph represents


Tags
CCSS.HSA.CED.A.2
CCSS.HSA.REI.D.10
2.
MULTIPLE CHOICE QUESTION
30 sec • 1 pt
Which graph represents


Tags
CCSS.HSA.CED.A.2
CCSS.HSA.REI.D.10
3.
MULTIPLE CHOICE QUESTION
45 sec • 1 pt

Which graph represents the table?


Tags
CCSS.8.EE.B.5
4.
MULTIPLE CHOICE QUESTION
30 sec • 1 pt
Which graph represents the equation
Tags
CCSS.HSA.CED.A.2
CCSS.HSA.REI.D.10
CCSS.HSF.IF.B.4
CCSS.HSF.IF.C.7
5.
MULTIPLE CHOICE QUESTION
30 sec • 1 pt
Which graph represents the equation


Tags
CCSS.HSA.CED.A.2
CCSS.HSA.REI.D.10
6.
MULTIPLE CHOICE QUESTION
1 min • 1 pt

Which graph represents the table?


Tags
CCSS.8.EE.B.5
7.
MULTIPLE CHOICE QUESTION
30 sec • 1 pt
Which graph represents the equation


Tags
CCSS.HSA.CED.A.2
CCSS.HSA.REI.D.10
CCSS.HSF.IF.B.4
CCSS.HSF.IF.C.7


Access all questions and much more by creating a free account
Create resources
Host any resource
Get auto-graded reports
Continue with Google

Continue with Email
Continue with Classlink
Continue with Clever
or continue with
Microsoft
%20(1).png)
Apple
Others
Already have an account?
Similar Resources on Wayground

20 questions
Integer, Multiplication 4-5
Quiz
•
6th - 8th Grade
20 questions
PROPORTIONS REVIEW
Quiz
•
7th Grade
15 questions
Adición y sustracción de Números Enteros
Quiz
•
7th Grade
20 questions
Linear Relationships Review
Quiz
•
8th - 9th Grade
12 questions
Tabuada do 4
Quiz
•
2nd - 9th Grade
12 questions
Q2 - MATH8 (CER PRACTICE)
Quiz
•
8th Grade
11 questions
Potenciación
Quiz
•
1st - 12th Grade
15 questions
7th Grade Math - Test Review (Algebra)
Quiz
•
7th Grade
Popular Resources on Wayground
15 questions
Fractions on a Number Line
Quiz
•
3rd Grade
20 questions
Equivalent Fractions
Quiz
•
3rd Grade
25 questions
Multiplication Facts
Quiz
•
5th Grade
29 questions
Alg. 1 Section 5.1 Coordinate Plane
Quiz
•
9th Grade
22 questions
fractions
Quiz
•
3rd Grade
11 questions
FOREST Effective communication
Lesson
•
KG
20 questions
Main Idea and Details
Quiz
•
5th Grade
20 questions
Context Clues
Quiz
•
6th Grade
Discover more resources for Mathematics
29 questions
Alg. 1 Section 5.1 Coordinate Plane
Quiz
•
9th Grade
14 questions
Volume of rectangular prisms
Quiz
•
7th Grade
14 questions
finding slope from a graph
Quiz
•
8th Grade
20 questions
Graphing Inequalities on a Number Line
Quiz
•
6th - 9th Grade
10 questions
Mean, Median, Mode, and Range
Quiz
•
7th Grade
23 questions
Mean median mode and range
Quiz
•
7th Grade
15 questions
Simple Probability
Quiz
•
7th Grade
8 questions
8th U6L1: Organizing Data
Quiz
•
8th Grade