
Dot Plots (Line Plots)
Presentation
•
Mathematics
•
6th Grade
•
Easy
+2
Standards-aligned

Tommy Fatigante
Used 24+ times
FREE Resource
5 Slides • 10 Questions
1
2
3

4
5
6
Multiple Choice

7
Multiple Choice

8
Multiple Choice

9
Multiple Choice
10
Multiple Choice

11
Multiple Choice

12
Multiple Choice

13
Multiple Choice

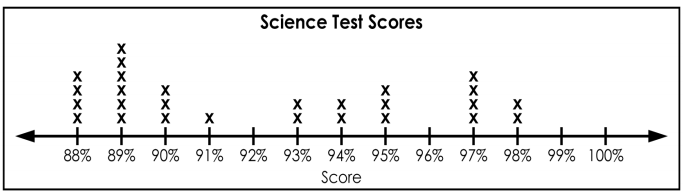
What is the Range of this data?
14
Multiple Choice

What is the Mode of this data?
15
Multiple Choice

What is the Mean of this data?
Show answer
Auto Play
Slide 1 / 15
SLIDE
Similar Resources on Wayground

10 questions
Dividing Fractions
Lesson
•
6th Grade
11 questions
Ratios, Rates and Proportions
Lesson
•
6th Grade
12 questions
Integers & Absolute Value
Lesson
•
6th Grade
12 questions
Histograms and Box Plot Review
Lesson
•
6th Grade
10 questions
Measurement Conversions using Proportions
Lesson
•
6th Grade
10 questions
Discount, Sales Tax and Tip
Lesson
•
6th Grade
10 questions
Double Number Lines Lesson
Lesson
•
6th Grade
10 questions
Composite Shapes
Lesson
•
6th Grade
Popular Resources on Wayground
15 questions
Fractions on a Number Line
Quiz
•
3rd Grade
20 questions
Equivalent Fractions
Quiz
•
3rd Grade
25 questions
Multiplication Facts
Quiz
•
5th Grade
29 questions
Alg. 1 Section 5.1 Coordinate Plane
Quiz
•
9th Grade
22 questions
fractions
Quiz
•
3rd Grade
11 questions
FOREST Effective communication
Lesson
•
KG
20 questions
Main Idea and Details
Quiz
•
5th Grade
20 questions
Context Clues
Quiz
•
6th Grade
Discover more resources for Mathematics
36 questions
6th Grade Math STAAR Review
Quiz
•
6th Grade
20 questions
Graphing Inequalities on a Number Line
Quiz
•
6th - 9th Grade
23 questions
Solve and Graph Inequalities
Quiz
•
6th Grade
15 questions
Distributive Property & Review
Quiz
•
6th Grade
17 questions
Area of a parallelogram
Quiz
•
6th Grade
15 questions
One- Step Equations
Quiz
•
6th Grade
12 questions
Two Step Equations
Quiz
•
6th Grade
15 questions
Volume of Triangular and Rectangular Prisms
Quiz
•
5th - 7th Grade