
Speed, Velocity, and Acceleration
Presentation
•
Science
•
9th - 12th Grade
•
Medium
+9
Standards-aligned

Christopher Powers
Used 3+ times
FREE Resource
25 Slides • 33 Questions
1

2
3
Multiple Choice
4
Multiple Choice
5

6

7

8

9
Multiple Choice
10
Multiple Choice
11
Multiple Choice
12
13
Multiple Choice
14
Multiple Choice
15
Multiple Choice
16
17
Multiple Choice
18
Multiple Choice
19
20
Multiple Choice
21
Multiple Choice
22

23

24
Multiple Choice
25
26
27
28

29

30
Multiple Choice
31
Multiple Choice

On this position vs time graph, describe the motion of A.
32
Multiple Choice
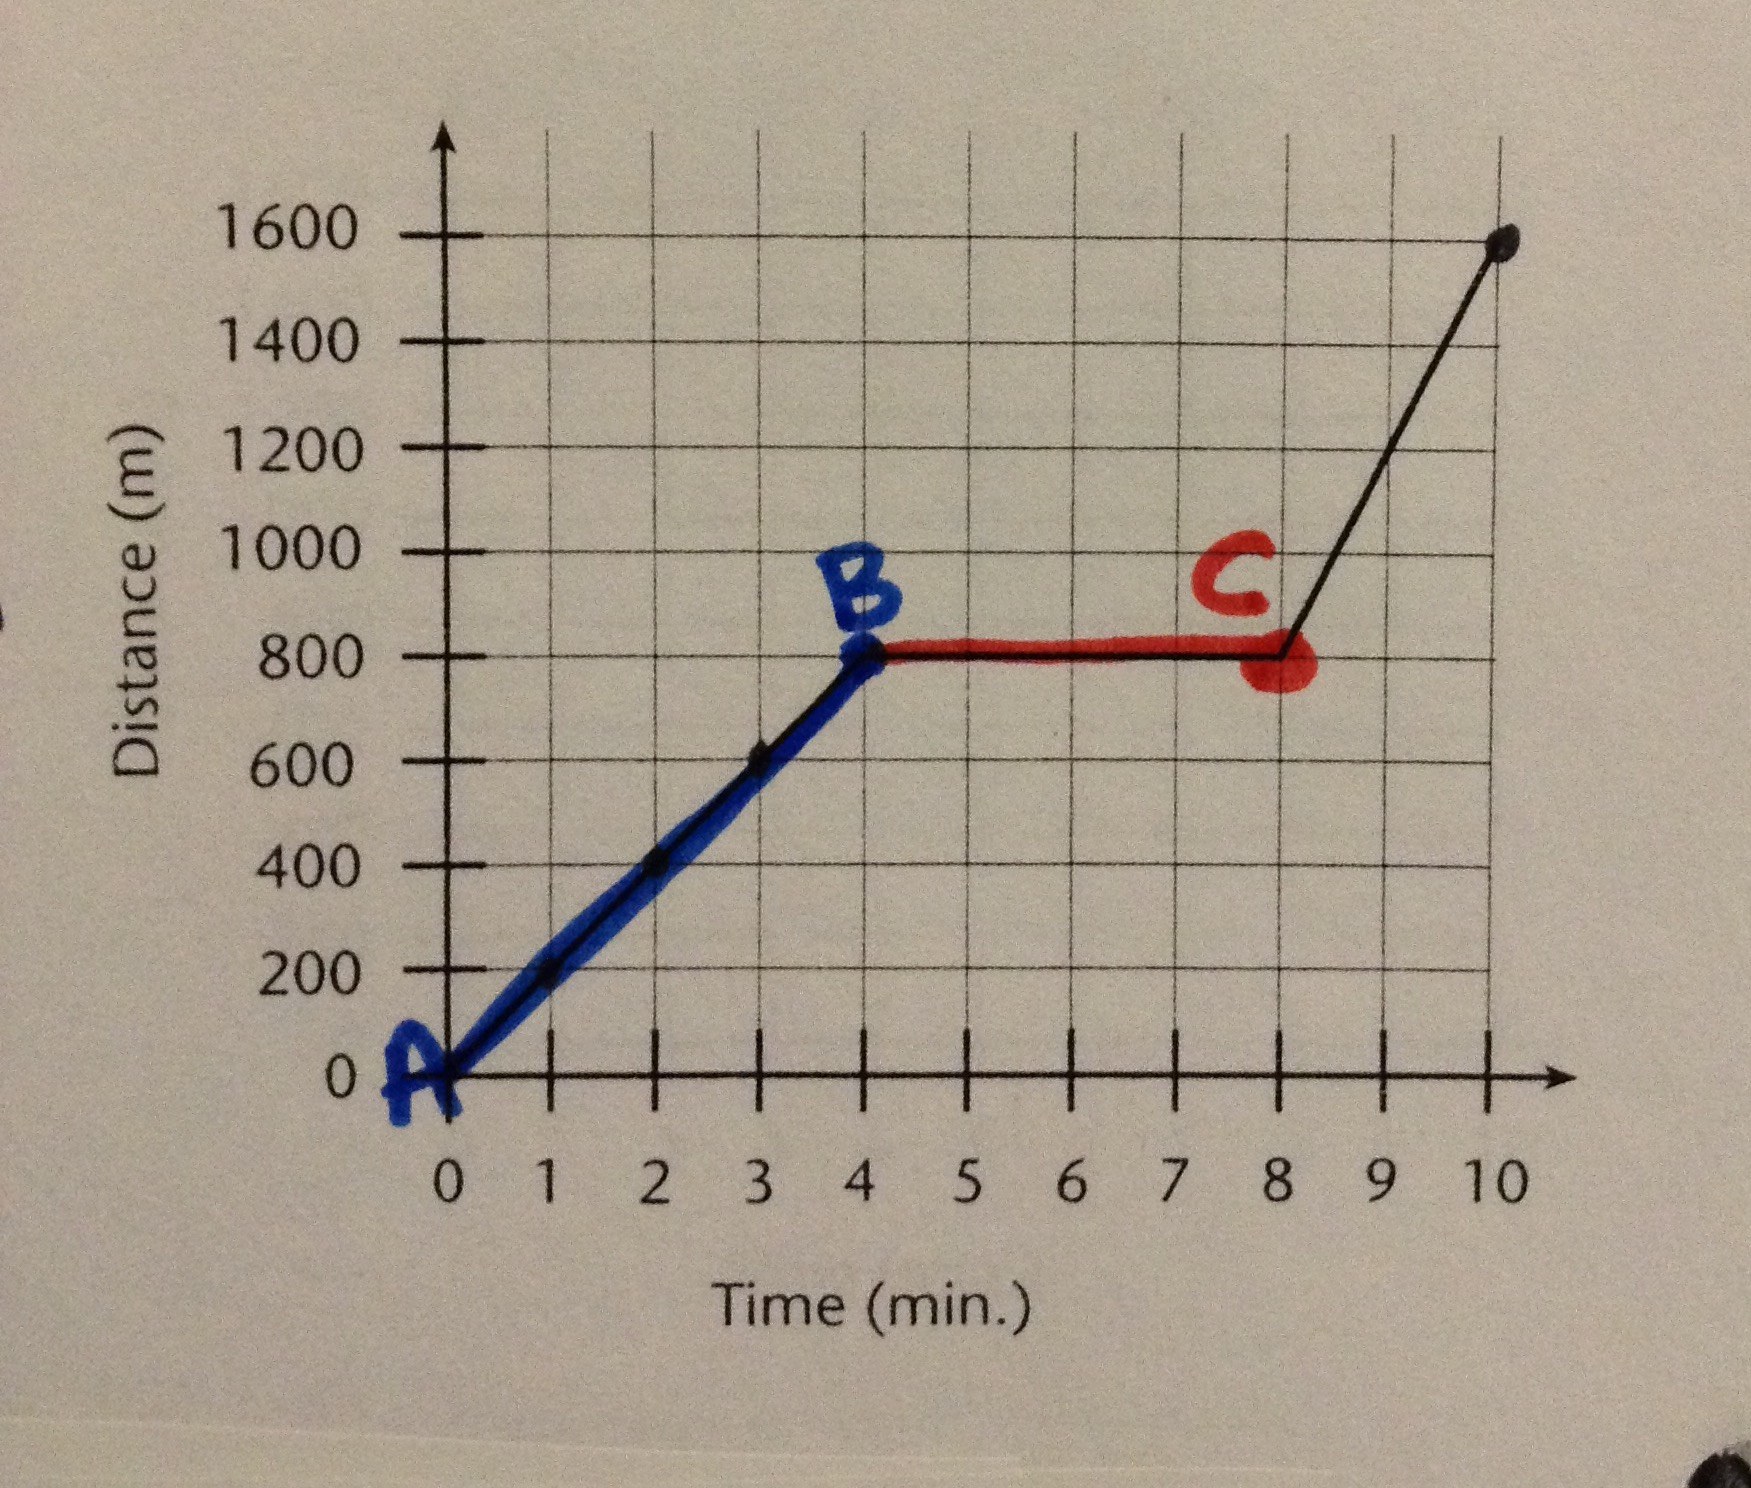
What is occurring from point A to point B?
33

34
Multiple Choice

35

36
Multiple Choice
37
Multiple Choice

38

39
Multiple Choice
40
Multiple Choice

41
Multiple Choice

42

43
Multiple Choice

On this position vs time graph, what is the velocity?
44
Multiple Choice

45
Multiple Choice

Anne cycles from Bristol to Salisbury.
The diagram shows the distance-time graph of her journey.
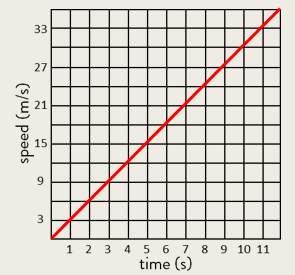
What is Anne's speed for the first two hours of her journey?
46

47

48

49

50


51
Multiple Choice

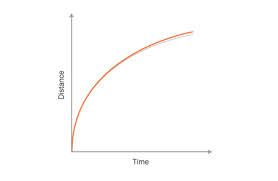
What is this graph showing?
52
Multiple Choice

What is this graph showing?
53
Multiple Choice

What is this graph showing?
54
Multiple Choice
55
Multiple Choice
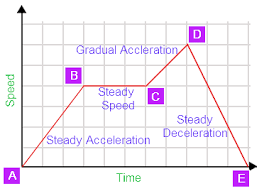
At what point is the speed the greatest?
56
Multiple Choice
57
Multiple Choice

58
Multiple Choice
Show answer
Auto Play
Slide 1 / 58
SLIDE
Similar Resources on Wayground

52 questions
Biodiversity Animals
Lesson
•
9th - 12th Grade
53 questions
Wildlife Conservation
Lesson
•
9th - 12th Grade
52 questions
Los Quehaceres (Pre-song story)
Lesson
•
9th - 12th Grade
53 questions
Lesson 3: EMS
Lesson
•
9th - 12th Grade
53 questions
Reading Graphs
Lesson
•
9th - 12th Grade
53 questions
DNA Replication and Cell Cycle
Lesson
•
9th - 12th Grade
52 questions
Lesson 5 - Using Communication Skills
Lesson
•
9th - 12th Grade
52 questions
Biodiversity Easy
Lesson
•
9th - 12th Grade
Popular Resources on Wayground
15 questions
Fractions on a Number Line
Quiz
•
3rd Grade
20 questions
Equivalent Fractions
Quiz
•
3rd Grade
25 questions
Multiplication Facts
Quiz
•
5th Grade
29 questions
Alg. 1 Section 5.1 Coordinate Plane
Quiz
•
9th Grade
22 questions
fractions
Quiz
•
3rd Grade
11 questions
FOREST Effective communication
Lesson
•
KG
20 questions
Main Idea and Details
Quiz
•
5th Grade
20 questions
Context Clues
Quiz
•
6th Grade
Discover more resources for Science
8 questions
Momentum and Collisions
Lesson
•
9th - 12th Grade
25 questions
Naming Ionic and Covalent Compounds
Quiz
•
9th Grade
10 questions
Exploring Weathering, Erosion, and Deposition Processes
Interactive video
•
6th - 10th Grade
10 questions
Cladogram Practice
Quiz
•
9th Grade
12 questions
The Respiratory System
Lesson
•
9th - 12th Grade
14 questions
Natural Selection and Adaptation
Lesson
•
9th - 12th Grade
10 questions
Exploring the Rock Cycle and Plate Tectonics
Interactive video
•
6th - 10th Grade
15 questions
Chemical Reactions (Types of Chemical Reactions)
Interactive video
•
11th Grade