
Venn Diagram and Two Way Tables
Presentation
•
Mathematics
•
7th - 11th Grade
•
Medium
John Chimbora
Used 4+ times
FREE Resource
20 Slides • 30 Questions
1
Venn Diagrams
Mr. Donnelly
2
Multiple Choice
3
4
Two Way Table Introduction
5
Two Way Table 1
The question asks what percent of girls have blonde hair. In order to determine a percent, I must first know the total number of girls. Add the numbers in the "girl column" 5+6+8+1=20 total girls. The number of girls with blonde hair is 6. To find a percent we say part divided by whole (total) so 6/20=.3 To change to a percent, move the decimal two places to the right and the answer is 30% of the girls have blonde hair.
6
Multiple Choice
7
Calculating from a word problem.
The question tells me I have a total of 25 students. 80% have an A average, but the question is asking how many students DO NOT HAVE AN A AVERAGE. Always make sure you answer the question being asked. We know that 100% makes up a total amount...it means all of! So if 80% have an A average, then 20% DO NOT have an A average, because 100-80=20. Now take .20 x 25 ( that is 25% of 25 students) and you get your answer...5 students do not have an A average.
8
9
2 Way Table-Be careful...answer the question being asked :)
The question is asking you to find the group that liked action movies the LEAST! Look under the Action column and find the smallest number.You will find it was the age group 18-25.
10
Multiple Choice
11
Relative Frequency...how often does something occur?
The question is asking asking only about boys. Remember, to find a percent take the part divided by the whole. The whole would be the total number of boys...in this case,11. We want to know how many can't bike to school...that number is 4. So I say 4/11=.3636.. Move the decimal two places to the right and round to the nearest whole number. Approximately 36% of the boys cannot ride a bike to school.
12
Union
13
Multiple Choice
The table shows incomplete info about customers' orders in a cafe. How many women visited the cafe in total?
37
15
22
12
14
Multiple Choice
15
Multiple Choice
How many total people were surveyed?
224
448
131
146
16
Intersection
17
Multiple Choice
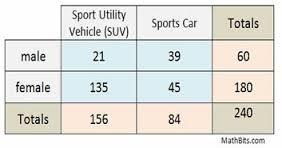
What percentage of SUV's are driven by women?
56.25%
75%
83.25%
86.5%
18
Multiple Choice
Identify the shaded area...
A
B
A'
B'
19
Multiple Choice
How many children prefer vanilla ice cream?
78
131
26
105
20
Multiple Choice
What section is shaded?
A
B
A∪B
A∩B
21
Multiple Choice
How many adults took this survey?
52
41
93
131
22
Multiple Choice
Identify the shaded area...
A∩B
A∪B
A'∩B'
A'∪B'
23
Multiple Choice
24
Multiple Choice
What section is shaded?
A
B
A∪B
A∩B
25
Multiple Choice
26
Multiple Choice
Identify the shaded area...
A∩B
A∪B
A'∩B'
A'∪B'
27
28
Multiple Choice
Identify the shaded area...
A∩B
A∪B
A'∩B'
A'∪B'
29
Example
On the 2 side walls there is a scenario, look which section you are under. What kind of even is this, disjointed or overlapping?
January to July
August to December
30
Multiple Choice
The diagram shows the sports played by 80 students.
If a student is picked at random, what is the probability that they play football only?
66/80
4/80
18/80
49/80
31
Example
On the 4 walls there is a new scenario, look which section you are under. What kind of even is this, disjointed or overlapping?
January to July
Birthday 1st 15 days of Jan. to July
32
Multiple Choice
The diagram shows the sports played by 80 students.
If a student is picked at random, what is the probability that they play all three sports?
31/80
45/80
62/80
67/80
33
34
150 college freshmen were interviewed. 85 were registered for a Math class, 70 were registered for an English class,50 were registered for both Math and English.
Example
Math
English
35
In a class of 30 students, 19 are studying French, 12 are studying Spanish and 7 are studying both French and Spanish. How many students are not taking any foreign languages?
Draw on Dry Erase Board
French
Spanish
36
Stroudsburg middle school awarded 21 medals to students who excelled in art and 35 medals to students for proficiency in dramatics. Fifteen students received medals in both the categories. Represent the data in a Venn diagram.
Draw on Dry Erase Board
Art
Dramatics
37
Multiple Choice
How many students like skiing or volleyball?
12
48
14
33
63
38
Fill in the Blank
How many students like none of the sports?
39
Fill in the Blank
How many students like all three sports?
40
Fill in the Blank
How many students were surveyed
41
A method to display to types of data.
42
Multiple Choice
How many male students studied French?
18
13
24
17
43
Multiple Choice
How many female students studied a language?
31
41
30
42
44
We are going to have to fill in the missing numbers using the "clues" that are provided.
45
The total number of Drama students is 27. 13 was the number of boys in the Drama column, so 13 girls are in Drama
46
Multiple Choice
47
Multiple Choice
How many Males have Masters/Doctoral Degree?
16
3
46
62
48
Multiple Choice
How many Bachelor's Degrees were given?
46
51
97
5
49
Multiple Choice
This table shows the number of female and male students in each science class. How many students are taking biology?
18
8
80
26
50
Multiple Choice
How many athletes were surveyed in all?
50
150
100
200
Venn Diagrams
Mr. Donnelly
Show answer
Auto Play
Slide 1 / 50
SLIDE
Similar Resources on Wayground
41 questions
Simplify Expressions by Combining Like Terms
Lesson
•
7th - 11th Grade
41 questions
Combining Like Terms with Rational Numbers
Lesson
•
7th - 11th Grade
43 questions
Cell Cycle and Mitosis
Lesson
•
7th - 10th Grade
48 questions
F&F 6 Units 10-12 Review
Lesson
•
KG
42 questions
3.3 Inequalities on the Number Line
Lesson
•
KG
43 questions
Introducing Speed
Lesson
•
7th - 10th Grade
44 questions
Primary Academic Refresher
Lesson
•
KG
48 questions
Unit 1 Review - Geometry Basics
Lesson
•
8th - 10th Grade
Popular Resources on Wayground
10 questions
5.P.1.3 Distance/Time Graphs
Quiz
•
5th Grade
10 questions
Fire Drill
Quiz
•
2nd - 5th Grade
20 questions
Equivalent Fractions
Quiz
•
3rd Grade
15 questions
Hargrett House Quiz: Community & Service
Quiz
•
5th Grade
20 questions
Main Idea and Details
Quiz
•
5th Grade
20 questions
Context Clues
Quiz
•
6th Grade
20 questions
Inferences
Quiz
•
4th Grade
15 questions
Equivalent Fractions
Quiz
•
4th Grade
Discover more resources for Mathematics
14 questions
Volume of rectangular prisms
Quiz
•
7th Grade
15 questions
Pythagorean Theorem Word Problems Quizizz
Quiz
•
8th Grade
16 questions
Simple Probability
Quiz
•
7th Grade
22 questions
Simple Probability
Quiz
•
7th Grade
20 questions
Graphing Inequalities on a Number Line
Quiz
•
6th - 9th Grade
10 questions
Exploring Basic Probability Concepts
Interactive video
•
6th - 10th Grade
73 questions
Math 8 Benchmark Review
Quiz
•
8th Grade
20 questions
Pythagorean Theorem Review
Quiz
•
8th Grade