
Dot Plots
Presentation
•
Mathematics
•
6th - 8th Grade
•
Medium
+3
Standards-aligned
Wayground Content
Used 144+ times
FREE Resource
10 Slides • 11 Questions
1
Lesson 2.1.1 - Dot Plots


2
Dot Plots
Dot plots are a convenient way to look at how data is distributed across its values. You can see which values show up most often and how spread out the data is.
Dot plots are best used with numerical data all rounded the same. Whole numbers are most convenient, but decimals can work, too.
3
Dot Plots
Each dot in a dot plot is a data point plotted along a horizontal axis. Duplicate values are stacked. In this plot, there are 50 data values represented. The value 6 is present 4 times in the set.
4
Please answer the next three questions
Thank you!
5
Multiple Choice
What is the highest score in the class?
88%
100%
13
98%
6
Multiple Choice
How many students spent 7 hours doing homework that week?
1
3
5
6
7
Multiple Choice
How many students read no books (zero) last summer?
6
1
4
3
8
Dot Plots
9
Please answer the next six questions
Thanks again!
10
Multiple Choice
How many people have 4 or more pets?
8
3
6
4
11
Multiple Choice
How many students scored 93% or less?
6
16
14
13
12
Multiple Choice
How many students scored between 95 and 100?
6
6
9
14
13
Multiple Choice
How many students received a score in the 80's?
2
10
14
27
14
Multiple Choice
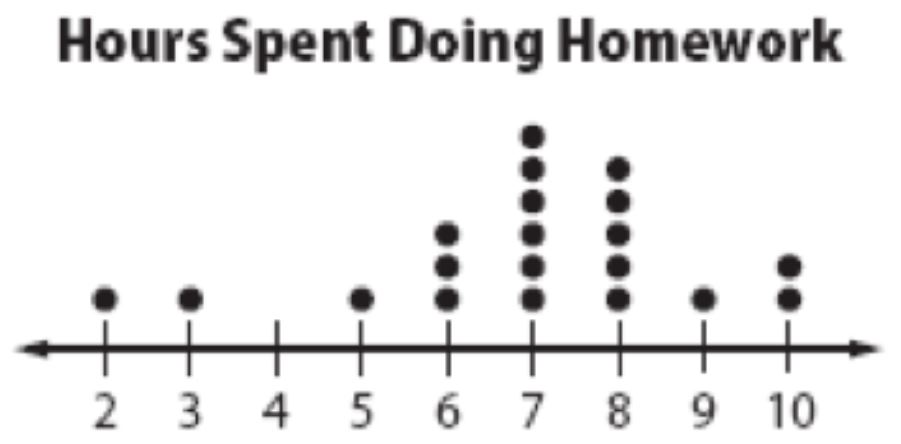
What is the greatest amount of time a student spent doing his homework?
2 hours
1 hour
6 hours
10 hours
15
Multiple Choice
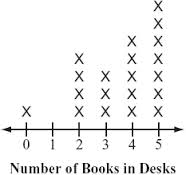
How many people have two or less books in their desk?
4
5
6
7
16
Building a Dot Plot
Building a dot plot is just a matter of plotting data points on a number line and stacking any duplicates. It's important that your number line be evenly spaced, so it's alright for there to be gaps.
17
Building a Dot Plot
The data set doesn't even have to be ordered. You just create a number line that will fit all the data and place a dot above the number for each value in the data set.
18
Last Question! Choose the dot plot that best matches the data.
Almost done!
19
Multiple Choice
20
Thank you for watching
You are now dot plot experts!
21
Dropdown
Lesson 2.1.1 - Dot Plots


Show answer
Auto Play
Slide 1 / 21
SLIDE
Similar Resources on Wayground
18 questions
Adding Integers
Presentation
•
6th - 8th Grade
19 questions
Ratio and Proportion
Presentation
•
6th - 8th Grade
16 questions
Slope From a Table 8.4C
Presentation
•
7th - 8th Grade
19 questions
Graphing on The Coordinate Plane Live Lesson Quizizz
Presentation
•
6th - 8th Grade
16 questions
Decimal Math: Adding and Subtracting
Presentation
•
6th - 8th Grade
17 questions
Comparing Fractions and Decimals
Presentation
•
6th - 8th Grade
17 questions
Unit 6: Probability - Lesson 1
Presentation
•
6th - 8th Grade
15 questions
solving Proportions using Cross-Products
Presentation
•
6th - 8th Grade
Popular Resources on Wayground
10 questions
5.P.1.3 Distance/Time Graphs
Quiz
•
5th Grade
10 questions
Fire Drill
Quiz
•
2nd - 5th Grade
20 questions
Equivalent Fractions
Quiz
•
3rd Grade
22 questions
School Wide Vocab Group 1 Master
Quiz
•
6th - 8th Grade
20 questions
Main Idea and Details
Quiz
•
5th Grade
20 questions
Context Clues
Quiz
•
6th Grade
20 questions
Inferences
Quiz
•
4th Grade
12 questions
What makes Nebraska's government unique?
Quiz
•
4th - 5th Grade
Discover more resources for Mathematics
10 questions
Box Plots
Quiz
•
6th - 7th Grade
14 questions
Volume of rectangular prisms
Quiz
•
7th Grade
15 questions
Pythagorean Theorem Word Problems Quizizz
Quiz
•
8th Grade
22 questions
Simple Probability
Quiz
•
7th Grade
10 questions
U7L3 Power of Powers of 10
Quiz
•
8th Grade
20 questions
Graphing Inequalities on a Number Line
Quiz
•
6th - 9th Grade
20 questions
Box and Whisker Plots
Quiz
•
6th Grade
20 questions
Ratios/Rates and Unit Rates
Quiz
•
6th Grade