
Box and Whisker Plots
Presentation
•
Mathematics
•
6th - 7th Grade
•
Medium
+3
Standards-aligned

Autumn Healy
Used 5+ times
FREE Resource
1 Slide • 23 Questions
1
2
Multiple Choice

3
Multiple Choice

4
Multiple Choice

5
Multiple Choice

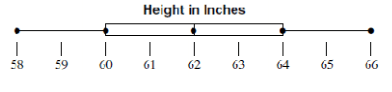
What is the approximate range of the data?
6
Multiple Choice

7
Multiple Choice

8
Multiple Choice

9
Multiple Choice

10
Multiple Choice

11
Multiple Choice

12
Multiple Choice

13
Multiple Choice

14
Multiple Choice

15
Multiple Choice

What is the difference between the medians?
(Hint: which operation uses "difference"?)
16
Multiple Choice

17
Multiple Choice

18
Multiple Choice

19
Multiple Choice
20
Multiple Choice

21
Multiple Choice

22
Multiple Choice

23
Multiple Choice

24
Multiple Choice

Show answer
Auto Play
Slide 1 / 24
SLIDE
Similar Resources on Wayground

16 questions
5.5 Percent Proportion: Find the Part
Lesson
•
6th - 7th Grade
19 questions
Angle Relationships
Lesson
•
6th - 8th Grade
19 questions
Area of Rectangles with fractional side lengths
Lesson
•
6th Grade
19 questions
Intro to Integers
Lesson
•
5th - 7th Grade
20 questions
Exponents and Order of Operations
Lesson
•
6th Grade
18 questions
Area of a triangle and trapezoid
Lesson
•
7th Grade
20 questions
Surface Area & Volume of Rectangular Prisms
Lesson
•
7th Grade
19 questions
Finding Radius or Diameter when Given Circumference
Lesson
•
7th Grade
Popular Resources on Wayground
15 questions
Fractions on a Number Line
Quiz
•
3rd Grade
10 questions
Probability Practice
Quiz
•
4th Grade
15 questions
Probability on Number LIne
Quiz
•
4th Grade
20 questions
Equivalent Fractions
Quiz
•
3rd Grade
25 questions
Multiplication Facts
Quiz
•
5th Grade
22 questions
fractions
Quiz
•
3rd Grade
6 questions
Appropriate Chromebook Usage
Lesson
•
7th Grade
10 questions
Greek Bases tele and phon
Quiz
•
6th - 8th Grade
Discover more resources for Mathematics
20 questions
Writing Algebraic Expressions
Quiz
•
6th Grade
20 questions
Ratios/Rates and Unit Rates
Quiz
•
6th Grade
14 questions
Volume of rectangular prisms
Quiz
•
7th Grade
15 questions
Graphing Inequalities
Quiz
•
7th - 9th Grade
20 questions
Graphing Inequalities on a Number Line
Quiz
•
6th - 9th Grade
20 questions
One Step Equations
Quiz
•
6th Grade
12 questions
One-Step Equations
Quiz
•
6th Grade
6 questions
Equations from models
Quiz
•
6th Grade