
Box and Whisker Plots
Presentation
•
Mathematics
•
7th - 9th Grade
•
Medium
+4
Standards-aligned

Melinda Lopez
Used 521+ times
FREE Resource
4 Slides • 23 Questions
1
Box and Whisker Plots

2
Five Number Summary
A box and whisker is created from five numbers called the Five Number Summary. This includes the Median, the lower quartile (Q1) , the upper quartile (Q3), the minimum (lowest number), and maximum (highest number).

3
Multiple Choice

4
Multiple Choice
5
Multiple Choice

6
Multiple Choice

7
Multiple Choice
8
Multiple Choice
9
Multiple Choice
10
Multiple Choice
11
Multiple Choice

What is the value of the lower quartile (Q1)?
12
Multiple Choice

13
Multiple Choice

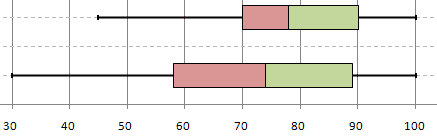
What is the least and greatest value of this data set?
14
Multiple Choice
What is the median of this data set?
15
Multiple Choice

What does point C on the box plot represent?
16
Range and Interquartile Range
Range and Interquartile Range are measures of variation, telling us how spread out the data is.
Range = Maximum - Minimum
Interquartile Range (IQR) - Range of the box
IQR = Q3 - Q1

17
Multiple Choice
What is the range of this data set?
18
Multiple Choice

19
Multiple Choice

20
Multiple Choice
21
Multiple Choice
22
Multiple Choice
What is the range of this data set?
23
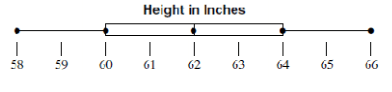
Percents on a Box and Whisker Plot
A box and whisker plot is broken up into quarters or quartiles. Each section of a box and whisker plot is worth 25%.
The box is 2 sections or 50% of the data.

24
Multiple Choice

What percent of students have heights between 60 inches and 66 inches?
25
Multiple Choice

26
Multiple Choice

27
Multiple Choice

Box and Whisker Plots
Show answer
Auto Play
Slide 1 / 27
SLIDE
Similar Resources on Wayground

18 questions
One Step Inequalities
Lesson
•
8th - 9th Grade
20 questions
Scatter Plots
Lesson
•
8th - 9th Grade
19 questions
Real Numbers
Lesson
•
7th - 8th Grade
20 questions
Unit 2 - Exponent Rules Review Lesson/Practice
Lesson
•
8th Grade
20 questions
Parts of Coordinate Planes
Lesson
•
6th - 10th Grade
21 questions
Area and Circumference of Circles
Lesson
•
8th Grade
21 questions
8th Grade
Lesson
•
8th Grade
18 questions
Solving Equations with Distributive Property
Lesson
•
7th - 8th Grade
Popular Resources on Wayground
15 questions
Fractions on a Number Line
Quiz
•
3rd Grade
20 questions
Equivalent Fractions
Quiz
•
3rd Grade
25 questions
Multiplication Facts
Quiz
•
5th Grade
29 questions
Alg. 1 Section 5.1 Coordinate Plane
Quiz
•
9th Grade
22 questions
fractions
Quiz
•
3rd Grade
11 questions
FOREST Effective communication
Lesson
•
KG
20 questions
Main Idea and Details
Quiz
•
5th Grade
20 questions
Context Clues
Quiz
•
6th Grade
Discover more resources for Mathematics
29 questions
Alg. 1 Section 5.1 Coordinate Plane
Quiz
•
9th Grade
14 questions
Volume of rectangular prisms
Quiz
•
7th Grade
14 questions
finding slope from a graph
Quiz
•
8th Grade
20 questions
Graphing Inequalities on a Number Line
Quiz
•
6th - 9th Grade
10 questions
Mean, Median, Mode, and Range
Quiz
•
7th Grade
23 questions
Mean median mode and range
Quiz
•
7th Grade
15 questions
Simple Probability
Quiz
•
7th Grade
8 questions
8th U6L1: Organizing Data
Quiz
•
8th Grade