
LT 10D: Interpret and Compare Histograms
Presentation
•
Mathematics
•
9th - 12th Grade
•
Medium
+2
Standards-aligned

Erika Foster
Used 5+ times
FREE Resource
4 Slides • 22 Questions
1

2

3

4
Multiple Choice

5
Multiple Choice

6
Multiple Choice

7
Multiple Choice

8
Multiple Choice

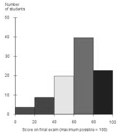
21. How many students are represented by the histogram?
9
Multiple Choice

10
Multiple Choice

What percentage of cities have a monthly temperature of less than 80 degrees?
11
Multiple Choice

How many parks have at least 40 trees?
12

13
Multiple Choice
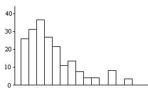
How would you describe this distribution?
14
Multiple Choice

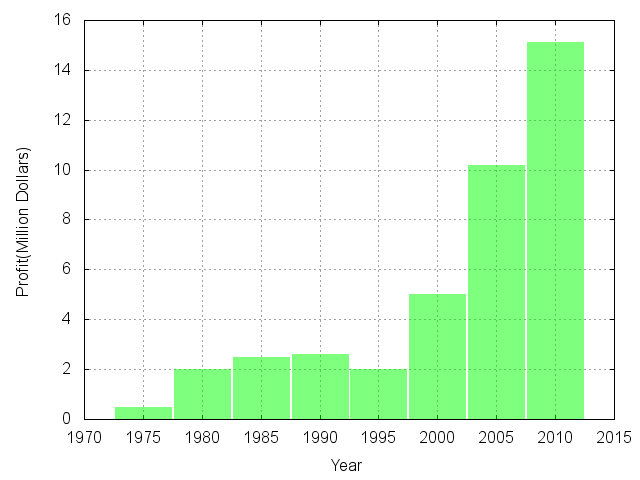
Describe the histogram:
15
Multiple Choice
What is the shape of this bar graph?
16
Multiple Choice
17
Multiple Choice
18
Multiple Choice

What is the range of ages shown in this histogram?
19
Multiple Choice

What appears to be the approximate median hours of screen time?
20
Multiple Choice

Which best describes the shape of this histogram?
21
Multiple Choice

22
Multiple Choice

23
Multiple Choice

What percentage of the students sent between 40 and 59 text messages?
24
Multiple Choice

How many students sent more than 29 text messages?
25
Multiple Choice

26
Multiple Choice

Show answer
Auto Play
Slide 1 / 26
SLIDE
Similar Resources on Wayground

21 questions
Special Right Triangles
Lesson
•
9th - 12th Grade
20 questions
The Multiplication Rule of Probability
Lesson
•
9th - 12th Grade
19 questions
Quadratic Formula
Lesson
•
9th - 12th Grade
19 questions
Standard Form of a Quadratic Function
Lesson
•
9th - 12th Grade
19 questions
Best Method for Solving Quadratics
Lesson
•
9th - 12th Grade
18 questions
Fractions Intro
Lesson
•
KG - 12th Grade
20 questions
Solve Quadratics by Graphing
Lesson
•
9th - 12th Grade
20 questions
Module 10: Lesson 1: Polynomials
Lesson
•
9th - 12th Grade
Popular Resources on Wayground
15 questions
Fractions on a Number Line
Quiz
•
3rd Grade
20 questions
Equivalent Fractions
Quiz
•
3rd Grade
25 questions
Multiplication Facts
Quiz
•
5th Grade
29 questions
Alg. 1 Section 5.1 Coordinate Plane
Quiz
•
9th Grade
22 questions
fractions
Quiz
•
3rd Grade
11 questions
FOREST Effective communication
Lesson
•
KG
20 questions
Main Idea and Details
Quiz
•
5th Grade
20 questions
Context Clues
Quiz
•
6th Grade
Discover more resources for Mathematics
29 questions
Alg. 1 Section 5.1 Coordinate Plane
Quiz
•
9th Grade
20 questions
Graphing Inequalities on a Number Line
Quiz
•
6th - 9th Grade
20 questions
Box and Whisker Plots
Quiz
•
9th Grade
18 questions
Exponential Growth and Decay
Quiz
•
9th Grade
20 questions
Function or Not a Function
Quiz
•
8th - 9th Grade
20 questions
SSS/SAS
Quiz
•
9th - 12th Grade
14 questions
Making Inferences From Samples
Quiz
•
7th - 12th Grade
23 questions
CCG - CH8 Polygon angles and area Review
Quiz
•
9th - 12th Grade