
Two-Way Frequency Tables
Presentation
•
Mathematics
•
9th - 11th Grade
•
Medium
Standards-aligned

Stephanie Roberts
Used 186+ times
FREE Resource
6 Slides • 5 Questions
1
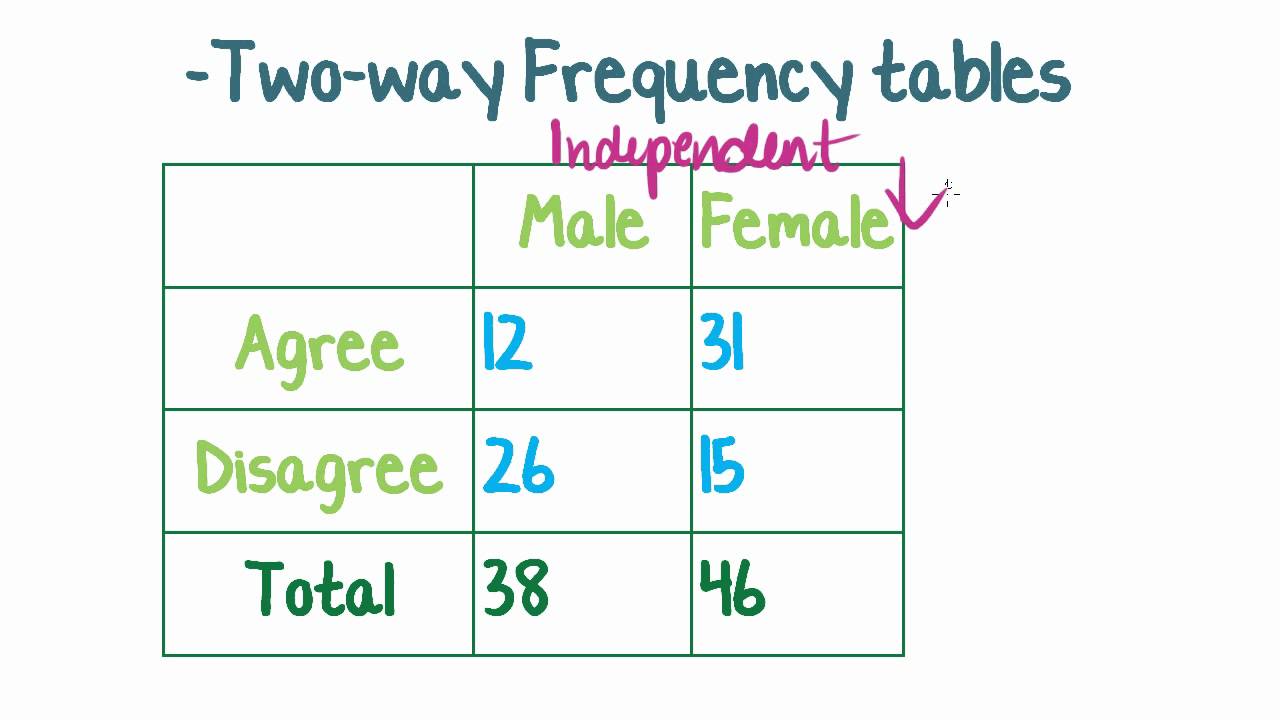
Two-Way Frequency Tables

2
How To Find Percents
Given a Two-Way Frequency Table

3
What percent of females agreed?
Determine the amount: 31 females agreed

4
Divide by total
31 + 15 = 46 females total

5
Decimal to Percent
MOST THE DECIMAL RIGHT TWO PLACES!
.67 as a percent - 67%
6

7
Multiple Choice

8
Multiple Choice

9
Multiple Choice

10
Multiple Choice

11
Multiple Choice

Two-Way Frequency Tables
Show answer
Auto Play
Slide 1 / 11
SLIDE
Similar Resources on Wayground

7 questions
conversión de unidades
Lesson
•
9th - 11th Grade
8 questions
Sequences
Lesson
•
10th - 11th Grade
10 questions
How Checking Works
Lesson
•
9th - 12th Grade
9 questions
Integrals using substitution
Lesson
•
9th - 12th Grade
10 questions
Histograms, Dot Plots and Frequency Tables
Lesson
•
9th Grade
10 questions
The Wildlife in the UAE
Lesson
•
9th - 11th Grade
9 questions
اللوغاريتمات والدوال اللوغاريتمية
Lesson
•
10th - 12th Grade
10 questions
Ángulos Elevación y Depresión
Lesson
•
10th Grade
Popular Resources on Wayground
15 questions
Fractions on a Number Line
Quiz
•
3rd Grade
20 questions
Equivalent Fractions
Quiz
•
3rd Grade
25 questions
Multiplication Facts
Quiz
•
5th Grade
29 questions
Alg. 1 Section 5.1 Coordinate Plane
Quiz
•
9th Grade
22 questions
fractions
Quiz
•
3rd Grade
11 questions
FOREST Effective communication
Lesson
•
KG
20 questions
Main Idea and Details
Quiz
•
5th Grade
20 questions
Context Clues
Quiz
•
6th Grade
Discover more resources for Mathematics
29 questions
Alg. 1 Section 5.1 Coordinate Plane
Quiz
•
9th Grade
20 questions
Graphing Inequalities on a Number Line
Quiz
•
6th - 9th Grade
20 questions
Box and Whisker Plots
Quiz
•
9th Grade
18 questions
Exponential Growth and Decay
Quiz
•
9th Grade
20 questions
Function or Not a Function
Quiz
•
8th - 9th Grade
20 questions
SSS/SAS
Quiz
•
9th - 12th Grade
14 questions
Making Inferences From Samples
Quiz
•
7th - 12th Grade
23 questions
CCG - CH8 Polygon angles and area Review
Quiz
•
9th - 12th Grade