
STATS Day 2 (4/20)
Presentation
•
Mathematics
•
9th Grade
•
Medium
+6
Standards-aligned

Kristine Nesslinger
Used 19+ times
FREE Resource
17 Slides • 15 Questions
1
STATS Day 2 (4/20)
Today we are going to learn about histograms, box plots, and distribution shapes.

2
3
4
Here's a situation
This list shows data of the number of minutes people could intensely focus on a task before needing a break. 50 people of different ages are represented
In a situation like this, it is helpful to represent the data graphically to better notice any patterns or other interesting features in the data.

5
Dot plots
A dot plot can be used to see the shape and distribution of the data. A dot plot is created by putting a dot for each value above the position on a number line.
Dot plots are useful when the data set it not too large and shows all of the individual values in the data set.
In our situation, a dot plot can easily show all the data (as seen right).
If the data set is very large (more than 100 values for example) or if there are many different values that are not exactly the same, a dot plot is probably not best to be used.

6
Open Ended

What is one thing you notice about our situation based on the dot plot?
7
Histograms
A histogram is another representation that shows the shape and distribution of the same data.
A histogram is made by counting the number of values from the data set in a certain interval and drawing a bar over that interval at a height that matches the count.
When creating histograms, each interval includes the number at the lower end of the interval but not the upper end. For example, the tallest bar displays values that are greater than or equal to 5 min but less than 10 min.
In a histogram, values that are in an interval are grouped together. Although the individual values get lost with the grouping, a histogram can still show the shape of the distribution.

8
Open Ended

What is one question you have about our situation based on the histogram?
9
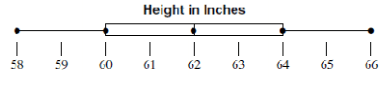
Box Plots
Box plots are created using the five-number summary.
For a set of data, the five-number summary consists of these five statistics: the minimum value, the first quartile, the median, the third quartile, and the maximum value.
These values split the data into four sections each representing approximately of the data.
To create a box plot, you need to find all five values of the five-number summary. Draw a vertical mark and then connect the pieces as the example create the box plot.

10
Multiple Choice

What is the median of our situation?
11
12
Multiple Choice
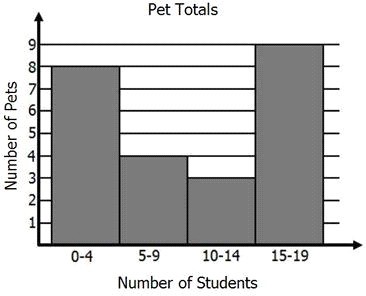
Which interval shows the greatest number of pets?
13
Multiple Choice

How many total people took the survey?
14
Multiple Choice
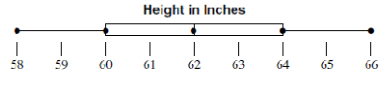
What value is the lower quartile?
15
Multiple Choice

What data value is the upper quartile (Q3)?
16
Multiple Choice
What is the interquartile range (IQR)?
17
Multiple Choice
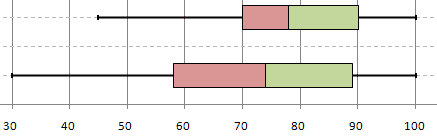
Which box and whisker plot has the highest median?
18
Open Ended

What is the ugliest vegetable and why?
19
20
21
Symmetric Distributions
In a symmetric distribution, the mean is equal to the median and there is a vertical line of symmetry in the center of the data display.
This distribution can also be called bell-shaped. A bell-shaped distribution has a dot plot that takes the form of a bell with most of the data clustered near the center and fewer points farther from the center. This makes the measure of center a very good description of the data as a whole. Bell-shaped distributions are always symmetric or very close to it.
To the right is an example of a symmetric distribution. The data set is the same for all representations.

22
Multiple Choice
23
Skewedness
In a skewed distribution, one side of the distribution has more values farther from the bulk of the data than the other side.
This results in the mean and median not being equal.
The data to the right is the same for all three representations.

24

25
Multiple Choice

In our example, what is the shape of its distribution?
26
Uniform Distribution
A uniform distribution has the data values evenly distributed throughout the range of the data. This causes the distribution to look like a rectangle.
In a uniform distribution, the mean is equal to the median since a uniform distribution is also a symmetric distribution.
The representations to the right are all the same data set.

27
Poll

What do you think? Does a uniform distribution have a mode?
28
Bimodal Distribution
A bimodal distribution has two very common data values seen in a dot plot or histogram as distinct peaks.
Sometimes, a bimodal distribution has most of the data clustered in the middle of the distribution. In these cases, the center of the distribution does not describe the data very well.
Bimodal distributions are not always symmetric. For example, the peaks may not be equally spaced from the middle of the distribution or other data values may disrupt the symmetry.

29
Multiple Choice
30
31
Fill in the Blank

The shape of this distribution is _________.
32

STATS Day 2 (4/20)
Today we are going to learn about histograms, box plots, and distribution shapes.
Show answer
Auto Play
Slide 1 / 32
SLIDE
Similar Resources on Wayground

24 questions
Intro to Systems of Linear Equations
Lesson
•
8th Grade
26 questions
Theoretical vs Experimental
Lesson
•
8th - 11th Grade
25 questions
Scatter Plots
Lesson
•
9th Grade
25 questions
Arithmetic Sequences
Lesson
•
9th Grade
27 questions
Slope of a Line
Lesson
•
9th Grade
21 questions
Best Method: Solving Systems of Equations
Lesson
•
7th - 10th Grade
25 questions
y=mx+b
Lesson
•
8th Grade
22 questions
Function vs. Not a Function
Lesson
•
8th - 9th Grade
Popular Resources on Wayground
15 questions
Fractions on a Number Line
Quiz
•
3rd Grade
10 questions
Probability Practice
Quiz
•
4th Grade
15 questions
Probability on Number LIne
Quiz
•
4th Grade
20 questions
Equivalent Fractions
Quiz
•
3rd Grade
25 questions
Multiplication Facts
Quiz
•
5th Grade
22 questions
fractions
Quiz
•
3rd Grade
6 questions
Appropriate Chromebook Usage
Lesson
•
7th Grade
10 questions
Greek Bases tele and phon
Quiz
•
6th - 8th Grade
Discover more resources for Mathematics
15 questions
Graphing Inequalities
Quiz
•
7th - 9th Grade
20 questions
Graphing Inequalities on a Number Line
Quiz
•
6th - 9th Grade
15 questions
Combine Like Terms and Distributive Property
Quiz
•
8th - 9th Grade
10 questions
Plotting Points on a Coordinate Plane: Quadrant 1 Essentials
Interactive video
•
6th - 10th Grade
20 questions
Perfect Squares and Square Roots
Quiz
•
9th Grade
10 questions
Exploring Abiotic and Biotic Factors in Ecosystems
Interactive video
•
6th - 10th Grade
20 questions
Function or Not a Function
Quiz
•
8th - 9th Grade
20 questions
SSS/SAS
Quiz
•
9th - 12th Grade