
Proportional Relationships
Presentation
•
Mathematics
•
7th Grade
•
Medium

Melissa Phillips
Used 24+ times
FREE Resource
5 Slides • 11 Questions
1

2
3

4
Multiple Choice
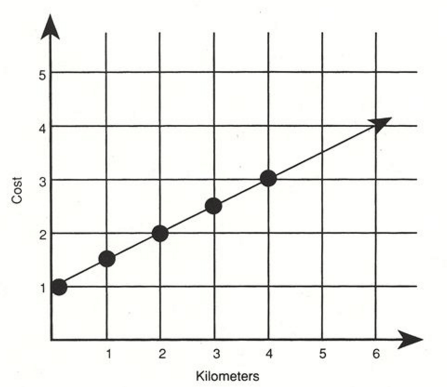
Is the graph proportional or non proportional?
5
Fill in the Blank

Why might someone think this graph from the previous slide would be considered proportional?
6
Multiple Choice

Does this graph represent a proportional relationship?
7
Poll
8
9
Multiple Choice

What is the constant of proportionality?
10
11
Multiple Choice
12
Fill in the Blank

The table represents the price of McDonald's Value Meals. Determine the constant of proportionality.
Express your as y = kx
13
Open Ended
14
Poll
15
Multiple Choice

The graph shows the relationship between the total cost (in dollars) and candy (in pounds) sold in a local school fundraiser.
Use the graph to determine the constant of proportionality.
Express your answer as y = kx
16
Multiple Choice

What does the constant, 3 represent in the previous question?
Show answer
Auto Play
Slide 1 / 16
SLIDE
Similar Resources on Wayground

14 questions
Scale Factor Review
Lesson
•
7th Grade
11 questions
Mark Up, Tax and Discounts
Lesson
•
7th Grade
11 questions
Discounts!!! :)
Lesson
•
7th Grade
12 questions
Probability Compound Events
Lesson
•
7th Grade
12 questions
Percent Increase and Decrease
Lesson
•
7th Grade
12 questions
Writing Equivalent Expressions
Lesson
•
7th Grade
10 questions
Lesson 1.6: Multiplying Integers
Lesson
•
7th Grade
14 questions
Gratuity
Lesson
•
7th Grade
Popular Resources on Wayground
15 questions
Fractions on a Number Line
Quiz
•
3rd Grade
10 questions
Probability Practice
Quiz
•
4th Grade
15 questions
Probability on Number LIne
Quiz
•
4th Grade
20 questions
Equivalent Fractions
Quiz
•
3rd Grade
25 questions
Multiplication Facts
Quiz
•
5th Grade
22 questions
fractions
Quiz
•
3rd Grade
6 questions
Appropriate Chromebook Usage
Lesson
•
7th Grade
10 questions
Greek Bases tele and phon
Quiz
•
6th - 8th Grade
Discover more resources for Mathematics
14 questions
Volume of rectangular prisms
Quiz
•
7th Grade
15 questions
Graphing Inequalities
Quiz
•
7th - 9th Grade
20 questions
Graphing Inequalities on a Number Line
Quiz
•
6th - 9th Grade
10 questions
Mean, Median, Mode, and Range
Quiz
•
7th Grade
12 questions
Simple Probability
Quiz
•
7th Grade
15 questions
Simple Probability
Quiz
•
7th Grade
15 questions
Volume of Triangular and Rectangular Prisms
Quiz
•
5th - 7th Grade
14 questions
Area of Composite Figures
Quiz
•
7th Grade