
Scatter Plots and Trend Lines
Presentation
•
Mathematics
•
8th Grade
•
Easy
+11
Standards-aligned

Matthew Olsen
Used 279+ times
FREE Resource
14 Slides • 20 Questions
1
Scatter Plots and Trend Lines

2
3
Multiple Choice
4
Multiple Choice
5

6
Open Ended

Is this trend line a good fit? Why or why not?
7
Open Ended

Is this trend line a good fit? Why or why not?
8
Open Ended

Is this trend line a good fit? Why or why not?
9
A good trend line
will help us make predictions. If we want to know an approximate cost per gallon of gas 10 years after 1970 (1980), we can use a trend line to help us!

10
If we travel out to 10 on the years (x) axis, we can then travel up to the trend line to make our prediction!
In 1980, the average cost of gas was $.75 per gallon! That's crazy!

11
12
13
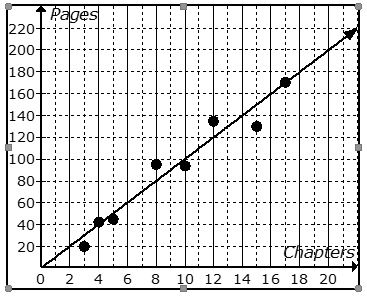
Open Ended

If x=10, what is a reasonable prediction for the value of y?
14
Open Ended

If y=225, what is a reasonable prediction for the value of x?
15
Multiple Choice

If x=5, what is a reasonable prediction for the value of y?
16
17

18
19
Let's start with the y-intercept (b)!
What is the y-intercept of this trend line?

20
Now let's find the slope!
By picking "smart points" and using our Rise (red) and our Run (blue) method, we can see that we have a rise of -2 and a run of 6. We can now make the ratio of
and we have our slope (m)!

21
Multiple Choice
22
23
Open Ended

What is the y-intercept of this line?
24
Open Ended

What is the slope of this line?
25
Open Ended

What is the equation for this trend line?
26
Multiple Choice

What is the equation for the trend line shown?
27
28
Multiple Choice
What is the type of correlation for the following scatter plot?
29
Multiple Choice

30
Multiple Choice

Write an equation for the trend line
31
Multiple Choice
32
Multiple Choice
33
Multiple Choice

34
Multiple Choice
Scatter Plots and Trend Lines
Show answer
Auto Play
Slide 1 / 34
SLIDE
Similar Resources on Wayground

26 questions
Intro to Translations
Lesson
•
8th Grade
27 questions
Relation & Function
Lesson
•
8th Grade
27 questions
Congruent triangles
Lesson
•
8th Grade
27 questions
Classifying Real Numbers
Lesson
•
8th Grade
25 questions
Slope y =mx
Lesson
•
8th Grade
24 questions
Introduction to Functions
Lesson
•
8th Grade
26 questions
Translating Expressions and Writing Equations
Lesson
•
7th - 8th Grade
Popular Resources on Wayground
15 questions
Fractions on a Number Line
Quiz
•
3rd Grade
20 questions
Equivalent Fractions
Quiz
•
3rd Grade
25 questions
Multiplication Facts
Quiz
•
5th Grade
29 questions
Alg. 1 Section 5.1 Coordinate Plane
Quiz
•
9th Grade
22 questions
fractions
Quiz
•
3rd Grade
11 questions
FOREST Effective communication
Lesson
•
KG
20 questions
Main Idea and Details
Quiz
•
5th Grade
20 questions
Context Clues
Quiz
•
6th Grade
Discover more resources for Mathematics
14 questions
finding slope from a graph
Quiz
•
8th Grade
20 questions
Graphing Inequalities on a Number Line
Quiz
•
6th - 9th Grade
8 questions
8th U6L1: Organizing Data
Quiz
•
8th Grade
20 questions
Slope from a Graph
Quiz
•
8th Grade
12 questions
8th U5 Test Review: Functions & Volume
Quiz
•
8th Grade
20 questions
Slope Intercept Form
Quiz
•
7th - 8th Grade
20 questions
Angle Relationships
Quiz
•
6th - 8th Grade
14 questions
Estimate and Classify Real Numbers
Quiz
•
8th Grade