Search Header Logo
Mean, Median and Mode

Mean, Median and Mode

Assessment

Presentation

Mathematics

9th Grade

Practice Problem

Medium

CCSS
6.SP.B.5C, 6.SP.B.4, 3.MD.B.3

+6

Standards-aligned

Created by

Blake Emerton

Used 94+ times

FREE Resource

11 Slides • 22 Questions

1

Mean, Median and Mode

media

2

Mean, Median, Mode and Range are common ways we use statistics to describe a data set

They all tell us something different about a data group

3

The Range of a list of numbers is just the difference between the largest and smallest value

**To find the range, subtract the smallest value from the largest value

Example: What is the range of the following data set?:

1, 20, 3, 8, 5, 21

Range = 21-1

Range = 20

4

Multiple Choice

Find the range of the data.

63, 71, 65, 66, 87, 53

1

32

2

33

3

34

4

35

5

Multiple Choice

Question image

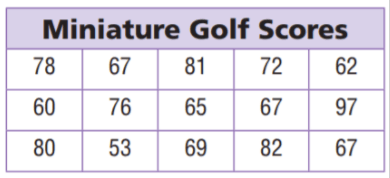
What is the range of miniature golf scores?

1

44 points

2

29 points

3

33 points

4

39 points

6

Mean is the average 

(sometimes written x̄)

We find the mean by adding all the data points and dividing by the total number of data points

Example: What is the mean of the following data set?:

2,6,8,4,9,10

Add the data points: 2+6+8+4+9+10= 39

And divide by the number of data points: 39/6

The mean (average) is 6.5

7

Multiple Choice

What is the definition of the mean?

1

The average

2

The middle number

3

The difference between the highest and lowest numbers

4

The number that occurs the most

8

Multiple Choice

What is a common symbol for mean?

1

x

2

3

\sqrt{ }

4

xy\sum_x^y

9

Multiple Choice

Find the mean:

28, 18, 19, 18, 17

1

20

2

18

3

11

4

19

10

The median is the middle number

We find the middle number but putting the data points in order

Example: What is the median of the following data set?:

21,13,14,16,18,13,13,13,14

Put the numbers in order and find the middle number:

13,13,13,13,14,14,16,18,21

The median is 14

11

Median continued...

What do you do if there is no "middle number" ?(even number of data points)

Find the average of the two middle numbers

Example: What is the median of the data set?

1,3,4,6,8,10

Find the average of the two middle numbers. The average of 4 and 6 is 5. Therefore, 5 is the median

12

Multiple Choice

Find the median:

5, 6, 3, 9, 0, 4, 1, 2, 7

1

4

2

4.1

3

5

4

4.5

13

Multiple Choice

Find the median:

3, 5, 7, 4, 3, 1

1

3 and 4

2

There isn't one

3

3.5

4

3

14

The Mode is the number that is repeated more often than any other

Example: What is the mode of the following data set?

1,1,2,2,5,5,5,8,9

5 is repeated 3 times to it is the mode of the data set

**You can have more than one mode. For example, in the following data set is considered "bi-modal" because it has 2 modes:

1,2,3,3,4,5,5,6

The mode is 3 and 5

15

Multiple Choice

Can there be more than one mode?

1

Yes

2

No

16

Multiple Choice

Find the mode:

5, 0, 9, 9, 3, 0, 5, 5, 4

1

9

2

5

3

3

4

7

17

A bar chart is a common way to show the relative size of data.

media

18

Multiple Choice

Question image

Which of the following statements is true?

1

banana is the most popular fruit

2

only pineapple is liked less than oranges

3

kiwi is the most popular fruit

4

apple is the third most popular fruit

19

Multiple Choice

Question image

In total, how many children take a taxi or cycle to school?

1

5

2

35

3

20

4

15

20

Multiple Choice

Question image

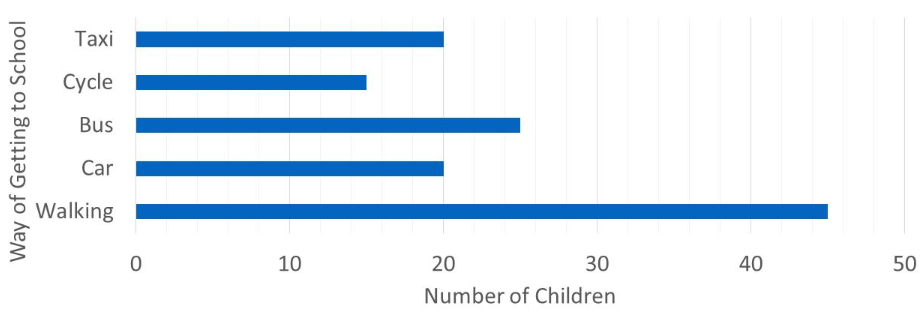
How many more children walk than take a taxi to school?

1

45

2

20

3

25

4

35

21

A histogram is like a bar chart but it groups data points into ranges

  • So a tree that is 260 cm tall is added to the "250-300" range.

media

22

media

23

Multiple Choice

Question image
How many cities have temperatures between 70 degrees and 99 degrees?
1
44
2
34
3
26
4
62

24

Multiple Choice

Question image
Which interval shows the greatest number of pets?
1
15-19
2
0-4
3
5-9
4
10-14

25

Multiple Choice

Question image
How many students were greater than or equal to 60 inches tall?
1
21
2
11
3
17
4
6

26

media

27

Multiple Choice

Question image
What is the MEAN for this data?
1
80
2
1040
3
13
4
81

28

Multiple Choice

Question image
What is the MEDIAN of this data?
1
65
2
40
3
915
4
13

29

Multiple Choice

Question image
What is the MODE of this data?
1
90
2
85, 90, and 95
3
85 and 95
4
None

30

Multiple Choice

Question image
What is the range of the test scores?
1
15
2
100
3
6
4
10

31

Multiple Choice

Question image
How many students received a score in the 80's?
1
2
2
10
3
14
4
27

32

Multiple Choice

Question image
How many students received a score of 94%? 
1
94
2
4
3
1
4
2

33

Multiple Choice

Question image
What is the highest score in the class?
1
88%
2
100%
3
13
4
98%

Mean, Median and Mode

media

Show answer

Auto Play

Slide 1 / 33

SLIDE