
Regressions Review
Presentation
•
Mathematics
•
9th - 10th Grade
•
Practice Problem
•
Medium
+1
Standards-aligned

Kimberly Milligan
Used 29+ times
FREE Resource
1 Slide • 14 Questions
1
Regressions Review

2
Multiple Choice
3
Multiple Choice
4
Multiple Choice
5
Multiple Choice

What is the regression line?
6
Multiple Choice

The linear regression equation is y = 61.93x - 1.79. According to the model, the slope can be interpreted as:
7
Multiple Choice

A person travels by car. They record their miles driven in a data table. Calculate the linear regression equation of this data.
8
Multiple Choice
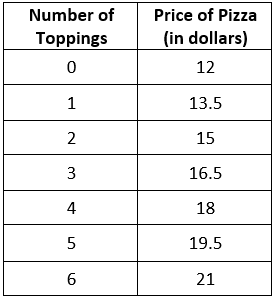
A restaurant sells pizza for the prices in the data table. Calculate the linear regression equation of the data.
9
Multiple Choice

10
Multiple Choice
The linear regression equation for the data is y = 1.5x + 12. Interpret the slope of the equation.
11
Multiple Choice

The table shown is comparing a person's foot length to their height in cm. Calculate a line of best fit.
12
Multiple Choice

What type of correlation best describes the scatterplot shown.
13
Multiple Choice

14
Multiple Choice

15
Multiple Choice

Regressions Review
Show answer
Auto Play
Slide 1 / 15
SLIDE
Similar Resources on Wayground

11 questions
HA2 Adding and Subtracting Rational Expressions Practice
Lesson
•
9th - 11th Grade
9 questions
Area of Triangles and Parallelograms
Lesson
•
9th - 10th Grade
10 questions
Intercepts from Standard Form
Lesson
•
9th Grade
10 questions
Histograms, Dot Plots and Frequency Tables
Lesson
•
9th Grade
10 questions
Identifying Slopes
Lesson
•
9th Grade
10 questions
Factoring Trinomials using the AC Method
Lesson
•
9th Grade
10 questions
Solving Systems of Equations by Graphing
Lesson
•
9th - 11th Grade
11 questions
Area of parallelogram
Lesson
•
9th Grade
Popular Resources on Wayground
15 questions
Fractions on a Number Line
Quiz
•
3rd Grade
20 questions
Equivalent Fractions
Quiz
•
3rd Grade
25 questions
Multiplication Facts
Quiz
•
5th Grade
29 questions
Alg. 1 Section 5.1 Coordinate Plane
Quiz
•
9th Grade
22 questions
fractions
Quiz
•
3rd Grade
11 questions
FOREST Effective communication
Lesson
•
KG
20 questions
Main Idea and Details
Quiz
•
5th Grade
20 questions
Context Clues
Quiz
•
6th Grade
Discover more resources for Mathematics
29 questions
Alg. 1 Section 5.1 Coordinate Plane
Quiz
•
9th Grade
20 questions
Graphing Inequalities on a Number Line
Quiz
•
6th - 9th Grade
20 questions
Box and Whisker Plots
Quiz
•
9th Grade
18 questions
Exponential Growth and Decay
Quiz
•
9th Grade
20 questions
Function or Not a Function
Quiz
•
8th - 9th Grade
20 questions
SSS/SAS
Quiz
•
9th - 12th Grade
14 questions
Making Inferences From Samples
Quiz
•
7th - 12th Grade
23 questions
CCG - CH8 Polygon angles and area Review
Quiz
•
9th - 12th Grade